How to Find Apps Using Too Much Memory in Activity Monitor
Discover how to identify apps using too much memory in Activity Monitor and improve your Mac's performance with simple steps.
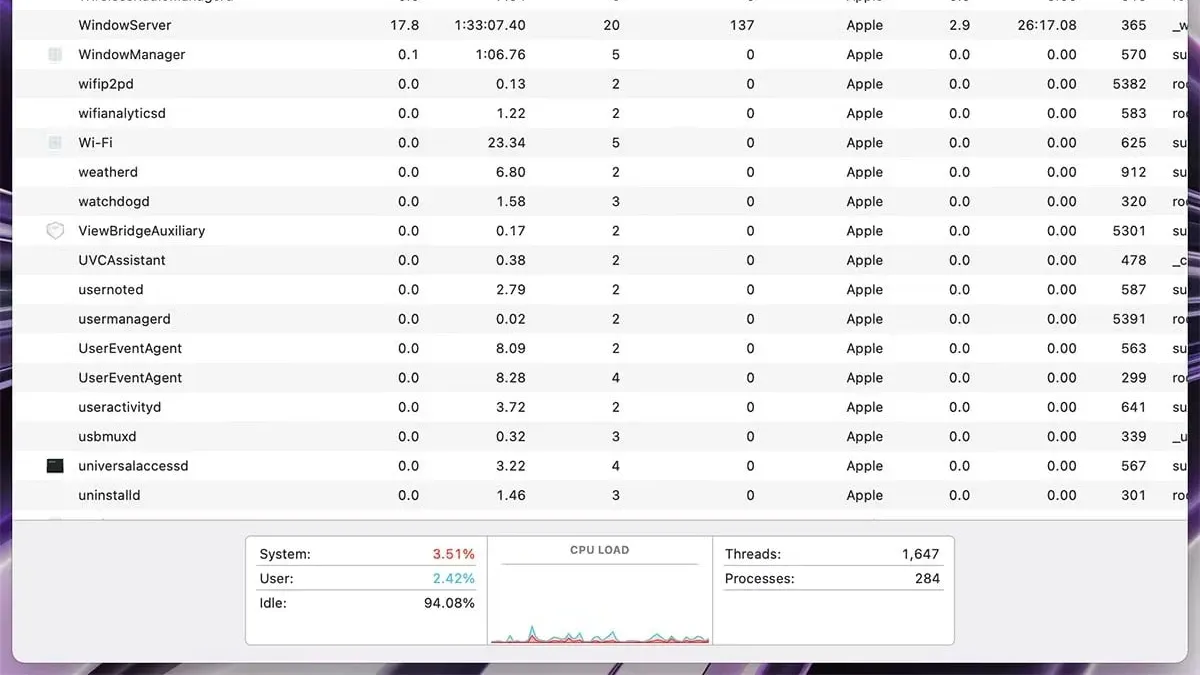
Your Mac feels sluggish, and apps sometimes freeze or take longer to respond. You might suspect that some programs are using too much of your system's memory, but you're not sure how to pinpoint which ones.
This article explains how to find apps using too much memory in Activity Monitor, guiding you step-by-step through checking memory consumption and interpreting the data. Instead of just opening Activity Monitor, you'll learn how to understand what the numbers mean and decide what action to take to keep your Mac running smoothly.
Key takeaways
- Open Activity Monitor and select the Memory tab to view real-time memory usage.
- Sort apps by Memory to quickly identify the highest consumers.
- Understand key memory metrics like "Memory Pressure" and "Compressed Memory."
- Consider closing or restarting apps with unusually high memory use.
- Monitor system memory regularly to prevent slowdowns.
Before You Start: What You Need to Know About Memory Usage
Your Mac’s memory, or RAM, is where active data lives so your system and apps can access it quickly. macOS manages RAM dynamically, using techniques like compressed memory to squeeze more data into RAM and swap files to move less-used information to your storage drive when RAM is running low. This helps keep your Mac responsive but can also cause slowdowns if memory resources are stretched too thin.
Activity Monitor tracks several key memory indicators to help you understand this usage. The Memory column shows how much RAM each app or process uses. Memory Pressure is a colored graph that reveals overall memory availability — green means plenty of free RAM, yellow and red indicate strain. Cached Files represent data stored in RAM for faster access but can be cleared if needed.
Before diving into Activity Monitor, check your Mac’s total RAM capacity in the Apple menu > About This Mac. For example, 8 GB of RAM will fill up faster than 16 GB when running the same apps, so seeing 3 GB used on an 8 GB Mac is more significant than the same on a 16 GB machine. Knowing this baseline will help you interpret what “high memory usage” really means for your setup.
Open Activity Monitor and Navigate to the Memory Tab
To begin examining which apps use the most memory, you first need to open Activity Monitor, a built-in macOS utility that tracks system resources. You can quickly launch it using Spotlight by pressing Command + Space, typing "Activity Monitor," and pressing Return. Alternatively, open Finder, go to Applications, then Utilities, and double-click Activity Monitor.
- Open Activity Monitor using either Spotlight or through Applications > Utilities.
- When Activity Monitor launches, click the Memory tab located near the top center of the window. This tab displays detailed information about app memory usage.
- Observe the columns in the Memory tab: Memory shows the amount of RAM each app is currently using, Real Mem indicates actual physical memory usage, and Compressed displays how much memory has been compressed to save space.
- Click the Memory column header to sort the list by memory usage. Apps using the most memory will appear at the top, making it easier to identify heavy users quickly.
For example, you might see Safari using around 1.5 GB of memory, while background apps may use only a few megabytes. This clear layout helps you spot memory-intensive apps at a glance, preparing you for deeper analysis.
Identify Apps Using Excessive Memory
Not all high memory usage signals a problem. Some apps, like professional video editors or virtual machines, naturally use more RAM. The key is to compare each app’s memory use to your Mac’s total RAM and typical usage patterns. For example, on an 8 GB Mac, an app using 2 GB or more could be considered heavy, while on a 32 GB Mac, that same 2 GB might be normal.
To spot apps using excessive memory, look for those that stand out compared to others. If most apps use a few hundred megabytes, but one uses multiple gigabytes without a clear reason, it’s worth noting. Check the “Memory” column in Activity Monitor and sort by descending memory usage to see which apps top the list.
Also, keep an eye on the memory pressure graph at the bottom of the window. Green indicates your system is managing memory well, but yellow or red signals stress. Swap usage, shown in the “Swap Used” field, reveals if your Mac is offloading data to disk because RAM is full. High swap usage combined with a memory-hungry app suggests it’s affecting performance.
- Sort apps by the “Memory” column by clicking its header. You should see apps listed from highest to lowest memory use.
- Identify apps that use a large portion of your total RAM—above roughly 25% of your total memory is often a good threshold to consider.
- Check the memory pressure graph below the list. Green means normal; yellow or red means your system is struggling.
- Look at the “Swap Used” value in the bottom right corner. Any nonzero value indicates your Mac is using disk space to supplement RAM.
- Note any apps with high memory use alongside yellow/red pressure or swap usage, as they may be the cause of slowdowns.
Analyze Memory Usage Details for Each App
Understanding the memory columns in Activity Monitor helps you grasp how each app impacts your system. Look at Private Memory, which is the RAM exclusively used by that app. Higher private memory means the app is holding onto more unique data. Shared Memory is memory shared with other apps or system processes, often libraries or frameworks; a high shared memory value indicates efficient resource use, as multiple apps reuse the same data.
Compressed Memory represents RAM that macOS has compressed to free up space—this helps when memory pressure is high. An app with significant compressed memory may be contributing to overall system strain but is also benefiting from macOS’s memory management.
- In Activity Monitor’s Memory tab, select an app you want to analyze. You’ll see its Private, Shared, and Compressed Memory columns beside the app name.
- Note the Private Memory value. For example, if Safari shows 1.2 GB private memory and 400 MB shared memory, it means Safari is using a substantial amount of its own memory while sharing some resources with other apps.
- Observe the Compressed Memory value. If it’s 300 MB, macOS is compressing part of Safari’s RAM to reduce memory pressure.
- To monitor changes over time, keep Activity Monitor open and watch these columns as you use the app. If private memory steadily grows, the app might have a memory leak or be handling large tasks.
- Use the Memory Pressure graph at the bottom to see how these app memory usages affect overall system health in real time.
Decide What to Do About High Memory Usage
Once you identify an app consuming a large amount of memory, you need to decide whether to quit it, force quit it, or take other measures. Quitting an app is appropriate if it is unresponsive or clearly causing system slowdowns; after quitting, you should notice an immediate drop in memory pressure and improved system responsiveness. However, some apps naturally use more memory without harming performance, so quitting them might be unnecessary.
Before force quitting, try quitting normally through the app’s menu or the Dock. If the app doesn’t respond, force quitting through Activity Monitor is justified. Alternatively, consider updating the app or your macOS, as developers often release fixes for memory leaks that cause excessive usage.
Restarting your Mac can also clear temporary memory issues and improve performance. For more detailed diagnostics, use the Console app to check system logs or third-party tools like EtreCheck to identify problematic processes beyond what Activity Monitor shows.
- Quit the high-memory app normally: Click the app’s name in the Activity Monitor, then press the stop sign icon and choose “Quit.” You should see a drop in memory usage and improved system speed.
- If the app doesn’t quit, force quit it: Select the app again, click the stop sign icon, and choose “Force Quit.” Confirm the app closes and check memory pressure decreases.
- Update the app and macOS: Open the App Store or the app’s website to install updates, then observe if memory usage stabilizes over time.
- Restart your Mac: Click the Apple menu and select “Restart.” After reboot, check Activity Monitor for reduced memory pressure and smoother performance.
- Use additional diagnostic tools: Open Console to review logs for recurring errors or install EtreCheck to generate a system report highlighting problematic apps that may need attention.
Troubleshoot Common Issues When Using Activity Monitor
If you notice memory usage numbers that seem confusing or inconsistent, first check if Activity Monitor has updated recently. It updates data every few seconds, but sometimes it may lag, showing outdated figures. To refresh manually, click the View menu and select "Update Frequency," then choose "Every Second" for real-time accuracy. If numbers still seem off, quitting and reopening Activity Monitor can resolve temporary glitches.
The Memory Pressure graph can spike unexpectedly, which might feel alarming. Spikes indicate your Mac is working harder to manage memory, often by compressing or swapping data. A brief spike is normal during heavy app use, but constant high pressure suggests you may need to close memory-intensive apps or restart your Mac to clear resources.
If Activity Monitor itself feels unresponsive or crashes, try restarting your Mac first. If the problem persists, boot into Safe Mode by holding the Shift key during startup; this disables extensions that might interfere. Also, ensure your macOS is up to date, as system updates often fix bugs affecting Activity Monitor’s performance.
Frequently asked questions
What does 'Memory Pressure' mean in Activity Monitor?
Memory Pressure is a visual indicator in Activity Monitor that shows how efficiently your Mac is managing its memory resources. When the graph is green, your system has plenty of free memory and is running smoothly. Yellow or red indicates that your Mac is struggling to allocate memory, which can lead to slower performance or increased use of swap space.
Is high memory usage always a problem?
Not necessarily. High memory usage can be normal if you are running several apps or memory-intensive tasks. macOS is designed to use available memory to improve performance, so some apps using a lot of memory is expected. You should be concerned only if your system feels slow or Memory Pressure stays high consistently.
Can I trust Activity Monitor’s memory readings completely?
Activity Monitor provides accurate real-time data on memory usage, but interpreting it correctly is key. Some memory is cached or compressed and not immediately freeable, so raw numbers alone don’t tell the whole story. Use Memory Pressure and the nature of the apps running to make informed judgments.
How often should I check which apps use the most memory?
There’s no set rule, but it’s a good idea to check when you notice your Mac slowing down or if apps are unresponsive. Periodic checks during heavy usage sessions help you spot memory hogs early. Otherwise, occasional monitoring is sufficient for most users.
What This Guide Doesn’t Cover
This guide focuses on identifying apps that use excessive RAM through Activity Monitor but does not address diagnosing issues related to CPU load or disk usage. If your Mac experiences frequent crashes, freezes, or unusually slow startup times, these may involve factors beyond memory consumption. Persistent or complex performance problems often require professional diagnostics or Apple Support assistance to properly resolve.
For users unfamiliar with system-level troubleshooting or those uncomfortable closing apps or modifying settings, seeking expert help is recommended to avoid unintended data loss or system instability.
To take the most practical next step, regularly monitor the "Memory Pressure" graph at the bottom of the Memory tab in Activity Monitor. This graph provides a clear, real-time indication of how strained your system’s RAM is. When you notice sustained yellow or red levels, focus on the top memory-consuming apps you identified earlier and consider quitting or managing them to free up resources and maintain smooth performance.
See also: How to Run First Aid in Disk Utility: A Step-by-Step Guide · How to Fix External Drive Not Mounting in Disk Utility · How to Check SSD Health Using Disk Utility: Step-by-Step Guide