How to Check CPU Temperature and Usage in Activity Monitor
Discover how to monitor your Mac’s CPU temperature and usage using Activity Monitor and trusted third-party apps for optimal performance.
Your Mac feels warmer than usual, or it’s running slower during tasks you normally breeze through. You want to know if the CPU is overheating or simply working harder than usual. This article explains how to check CPU temperature and usage in Activity Monitor, combined with third-party tools, so you can monitor your Mac’s health effectively.
You'll learn to find CPU usage within Activity Monitor, use reliable apps to see temperature readings, and interpret both together. This helps you decide when to close apps, adjust settings, or seek further troubleshooting. Clear, step-by-step instructions make it easy to follow along and understand what the numbers mean for your Mac’s performance.
Key takeaways
- Activity Monitor shows real-time CPU usage but not temperature.
- Use third-party apps like iStat Menus or Intel Power Gadget to see CPU temperature.
- High CPU usage combined with temperatures above 85°C may indicate overheating risk.
- Monitor the Energy tab in Activity Monitor for apps consuming excessive power.
- Regular monitoring helps prevent slowdowns and maintain optimal Mac performance.
Before You Start: What You Need to Monitor CPU Temperature and Usage
Activity Monitor, included with every Mac, provides detailed CPU usage statistics but does not display CPU temperature. To track your Mac’s CPU temperature, you will need a trusted third-party application. These apps read hardware sensors directly and present temperature data alongside other performance metrics.
Some reliable third-party options include Intel Power Gadget, iStat Menus, and Macs Fan Control. Intel Power Gadget is free and offers real-time temperature and frequency information but supports only Intel-based Macs. iStat Menus is a paid app with extensive monitoring features and works on both Intel and Apple Silicon Macs. Macs Fan Control is also free, focuses on fan speeds and temperatures, and supports both Mac architectures.
Before using these tools, ensure you have administrator privileges on your Mac, as some monitoring apps require this to access sensor data. You can find Activity Monitor by opening Finder, navigating to Applications > Utilities, and launching Activity Monitor from there.
- Open Finder and go to Applications > Utilities; you should see Activity Monitor listed. Opening it shows the CPU tab by default, where CPU usage is displayed.
- Download and install one of the recommended third-party apps based on your Mac’s processor type. After installation, launch the app and grant any requested permissions, such as accessibility or system monitoring, which often require administrator approval.
- Verify the app is reporting CPU temperature by checking its main window or menu bar icon, which should display temperature values in Celsius or Fahrenheit.
Open Activity Monitor and Locate CPU Usage Metrics
- Click the magnifying glass icon in the upper-right corner of your screen to open Spotlight Search. Type Activity Monitor and press Enter. You should see the Activity Monitor window open.
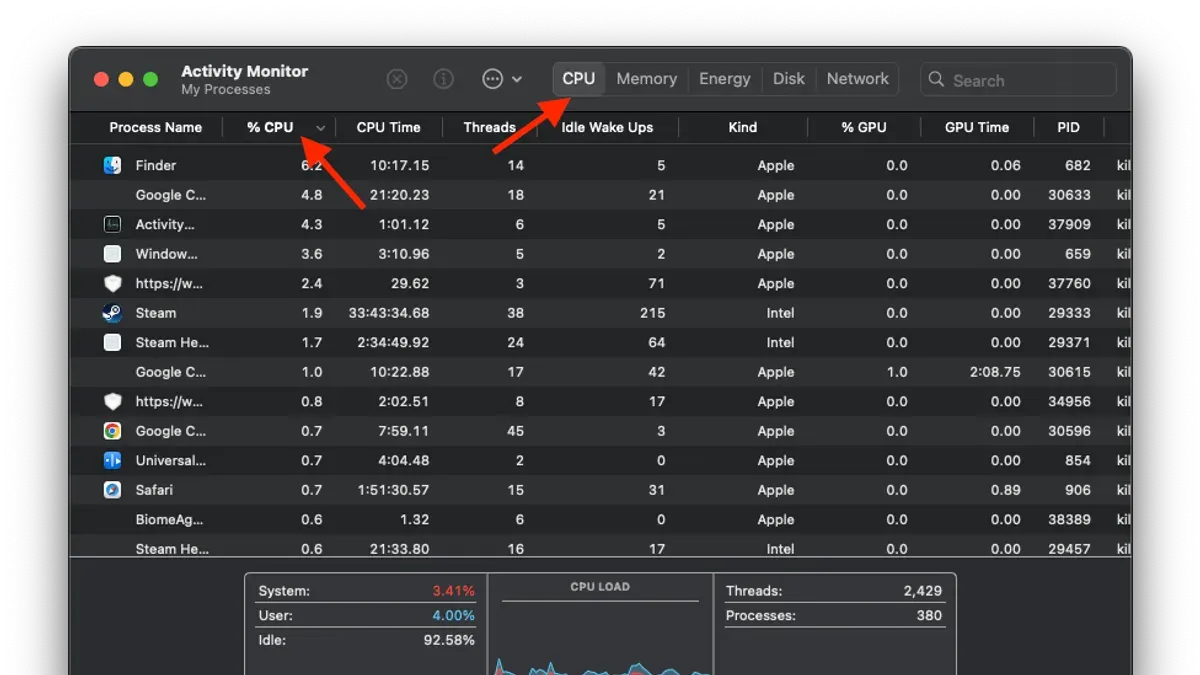
- In Activity Monitor, click the CPU tab at the top center. This tab displays real-time data about how your Mac's CPU is being used.
- Look at the columns under the CPU tab. % CPU shows the percentage of CPU capacity each process is using. A value of 100% means one CPU core is fully utilized. If you see 200%, that means two cores are fully in use, and so on.
- Review the CPU Time column to see how long each process has been using the CPU since it started. This helps you identify processes that consume a lot of CPU over time.
- Check the Threads column, which indicates how many threads a process is running. More threads can mean a process is handling multiple tasks simultaneously.
- Notice the Idle Wake Ups column, which counts how often a process wakes the CPU from idle. Frequent wake-ups can contribute to increased power usage and heat.
- When monitoring, watch for spikes in % CPU—these are short bursts of high usage that may be normal during certain tasks. Sustained high % CPU usage, especially close to or above 80-90%, can indicate a process that might be slowing down your Mac or causing it to heat up.
Below is a screenshot example of the CPU tab highlighting these key metrics, with a sample interpretation showing that a process using 150% CPU is utilizing one and a half CPU cores actively, which may be normal under heavy tasks but worth monitoring if it persists.
Check CPU Temperature Using a Third-Party App
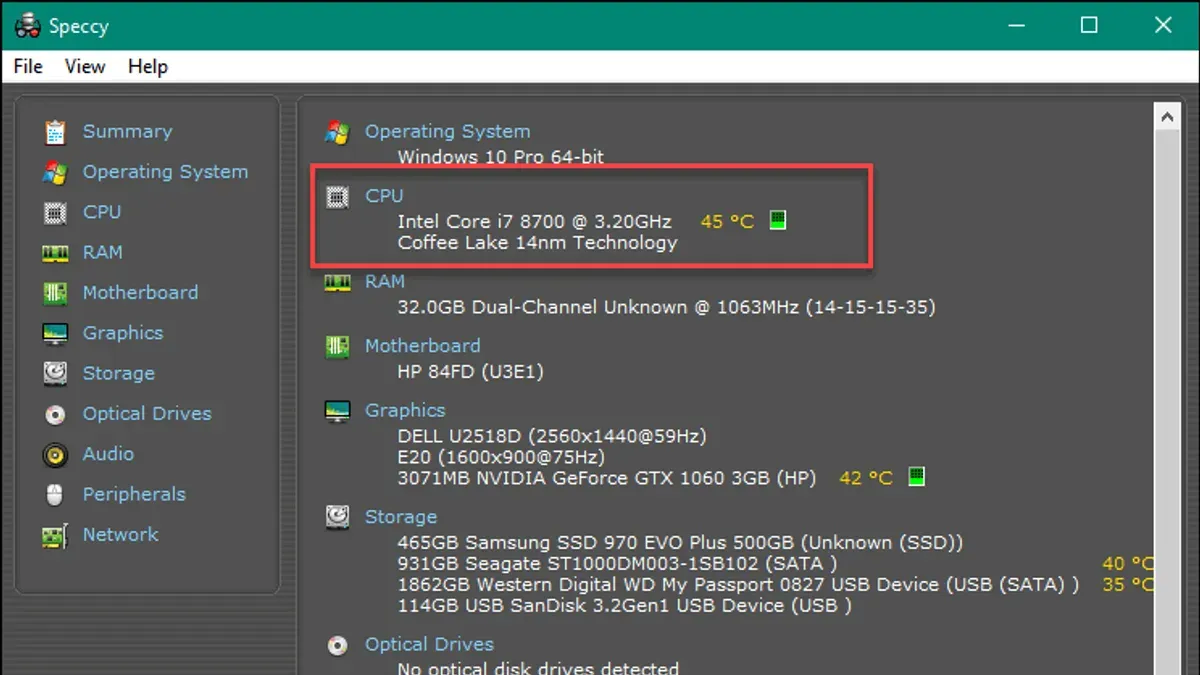
- Download and install a recommended app like "Intel Power Gadget" or "Macs Fan Control" from their official websites. After installation, launch the app; you should see real-time CPU temperature readings displayed prominently.
- Familiarize yourself with the temperature display. Typical idle temperatures for most Macs range between 30°C and 50°C, while normal active usage often falls between 60°C and 80°C. The app usually shows these values in an easy-to-read graph or numeric format.
- Understand safe operating temperatures. Generally, CPU temperatures below 85°C are safe, but sustained temperatures above 90°C indicate overheating. If your CPU temperature rises above this threshold, it’s a warning to check for excessive load or cooling issues.
- Keep the temperature monitor visible alongside Activity Monitor by using the app’s floating window or menu bar icon feature. This allows you to watch CPU temperature and usage simultaneously without switching apps.
- For example, when your Mac is idle, you might see a CPU temperature around 40°C. However, during heavy video editing, it could rise to 85°C. If it reaches 95°C, it’s time to reduce workload or improve ventilation to prevent hardware damage.
Interpret CPU Temperature and Usage Together to Make Informed Decisions
To get a clear picture of your Mac’s health, you need to combine CPU usage data from Activity Monitor with temperature readings from your third-party app. High CPU usage with normal temperature usually means your Mac is working hard but staying within safe limits. This could be during video editing or running complex software and often requires no immediate action.
Conversely, high CPU temperature combined with low CPU usage is a warning sign. It may indicate poor ventilation, dust buildup in vents, or background processes causing heat without significant activity. These situations can lead to performance throttling and potential hardware damage if ignored.
Background processes sometimes spike CPU usage unexpectedly. In Activity Monitor, sort by CPU column to spot any unfamiliar or consistently high-usage apps. Quitting or uninstalling such apps can reduce heat and improve performance.
- Check Activity Monitor’s CPU tab and note if CPU usage is high or low.
- Look at the temperature app’s reading for your CPU temperature.
- Refer to the table below to decide your next step.
| Scenario | What It Means | Recommended Action |
|---|---|---|
| High CPU Usage + Normal Temperature | Your Mac is busy but cooling effectively. | No immediate action needed; monitor if usage remains high for long periods. |
| Low CPU Usage + High Temperature | Possible ventilation issue or background process causing heat. | Check for background apps, clean vents, and consider hardware service if persistent. |
| High CPU Usage + High Temperature | Mac is under heavy load and may be overheating. | Quit unnecessary apps, improve airflow, or take breaks to cool down. |
| Low CPU Usage + Normal Temperature | Mac is idle or performing light tasks. | No action needed; this is normal. |
Understanding these scenarios helps you decide when to quit apps, clean hardware, or seek professional help, keeping your Mac running smoothly and avoiding unnecessary damage.
Use Activity Monitor’s Energy Tab to Complement CPU Monitoring
Switching to the Energy tab in Activity Monitor gives you valuable insight into how your CPU usage affects your Mac’s battery life and heat generation. To access it, click the “Energy” button at the top of the Activity Monitor window. Here, you’ll see metrics like Energy Impact, which estimates the current energy consumption of each app, and App Nap, indicating whether macOS is reducing the app’s background activity to save power.
Apps with a high Energy Impact often correspond to high CPU usage and increased temperature. For example, a video editing app might show an Energy Impact around 50, while a lightweight text editor’s impact could be under 5. Monitoring this helps you identify which apps contribute most to CPU load and heat.
To reduce energy consumption and lower CPU temperature, consider quitting or limiting apps with high Energy Impact when not in use. Also, check the “Preventing Sleep” column to spot apps that keep your Mac awake unnecessarily, as this can cause excessive CPU activity and heat buildup.
Troubleshoot Common Issues When Monitoring CPU Temperature and Usage
If Activity Monitor or your chosen third-party app fails to launch or display data, start by quitting the app completely and reopening it. If you see error messages like “Unable to access CPU data” or “Sensor data unavailable,” check that you have granted all necessary permissions under System Preferences > Security & Privacy > Privacy > Full Disk Access or Accessibility. Restarting your Mac can also resolve temporary glitches.
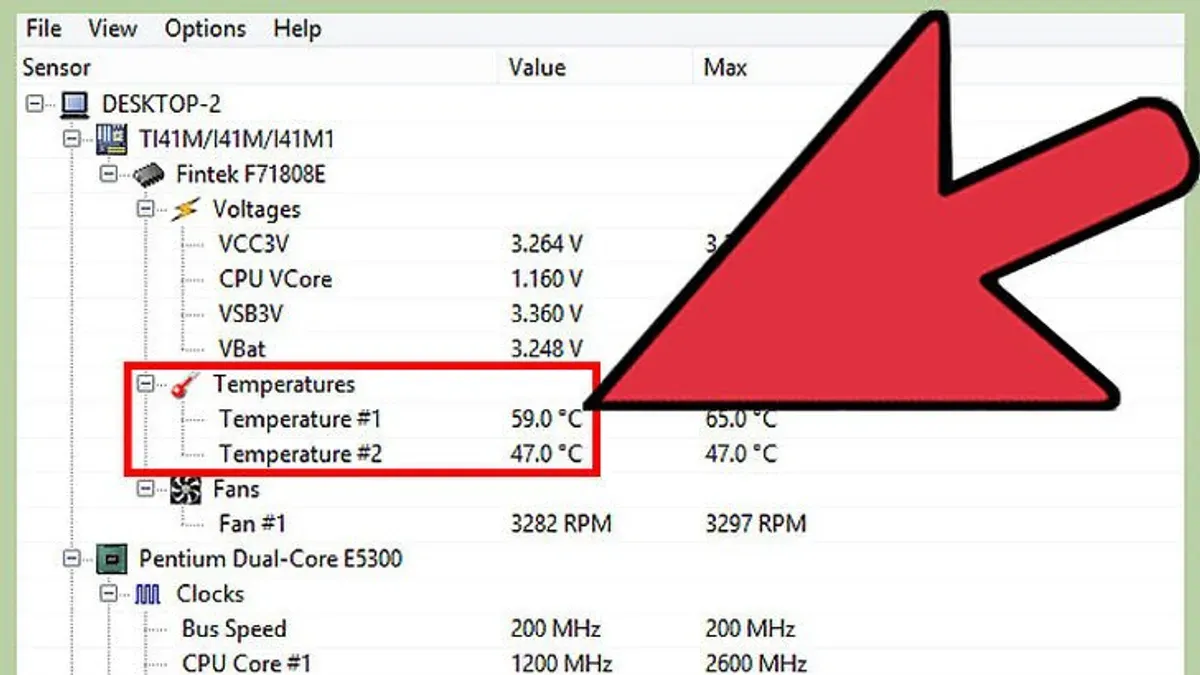
Inaccurate or missing temperature readings often result from outdated apps or sensor communication issues. Ensure your third-party app is updated to the latest version compatible with your macOS. If sensor data remains unreliable, resetting the System Management Controller (SMC) or Parameter RAM (PRAM) can recalibrate hardware monitoring functions.
- Shut down your Mac completely.
- For SMC reset on Intel Macs, press and hold the left-side Shift + Control + Option keys and the power button simultaneously for 10 seconds, then release and turn on your Mac. For M1 Macs, simply restarting is sufficient.
- To reset PRAM, turn on your Mac and immediately press and hold Command + Option + P + R keys for about 20 seconds, then release.
- Open Activity Monitor and your temperature app again to check if readings stabilize.
If your Mac continues to overheat despite low CPU usage and normal temperature readings, or if sensor errors persist after troubleshooting, consider consulting an Apple Authorized Service Provider. Persistent hardware issues like failing sensors or cooling system faults require professional diagnostics to prevent damage.
Frequently asked questions
Can I check CPU temperature directly in Activity Monitor?
No, Activity Monitor does not show CPU temperature directly. It provides information about CPU usage and processes but lacks temperature readings. To monitor CPU temperature, you need a third-party app designed for hardware sensors.
What is a safe CPU temperature range for my Mac?
Generally, a safe CPU temperature range for Macs is between 30°C and 85°C under typical workloads. Temperatures consistently above 90°C can indicate overheating and may require action. Keep in mind that idle temperatures are usually lower, around 30°C to 50°C.
Why is my CPU usage high but the temperature is low?
High CPU usage with low temperature can occur if your Mac has efficient cooling or if the tasks are not very demanding on the processor cores. Background processes or lightweight apps might push CPU usage percentages up without generating much heat. Also, the Mac’s thermal management may be effectively dissipating heat.
Which third-party apps are best for monitoring Mac CPU temperature?
Popular third-party apps for Mac CPU temperature monitoring include iStat Menus, Intel Power Gadget, and Macs Fan Control. These apps provide real-time temperature readings and often include additional system health data. Choose one based on your preference for interface and additional features like fan control.
Know the Limits of This Guide
This guide focuses on helping you monitor and understand CPU temperature and usage using Activity Monitor and reliable third-party apps. It does not cover advanced hardware diagnostics, repairs, or internal component replacements. If your Mac experiences persistent overheating, unexpected shutdowns, or performance issues despite following these steps, it is best to consult Apple Support or visit an authorized technician for professional assistance.
Taking care of your Mac’s health involves more than just monitoring metrics—it sometimes requires expert hardware evaluation that software tools cannot provide. Treat this guide as a starting point for everyday monitoring and informed decisions rather than a comprehensive hardware troubleshooting manual.
To keep your Mac running smoothly, the single most useful next step is to regularly check the Energy tab in Activity Monitor alongside CPU temperature readings. This combination helps you identify apps or processes that drain power and cause heat buildup, allowing you to close or manage them before they affect performance or battery life.
See also: How to Find Apps Using Too Much Memory in Activity Monitor