How to Check Disk Read and Write Activity in Activity Monitor
Discover how to check disk read and write activity in Activity Monitor to monitor your Mac’s disk usage and troubleshoot performance issues.
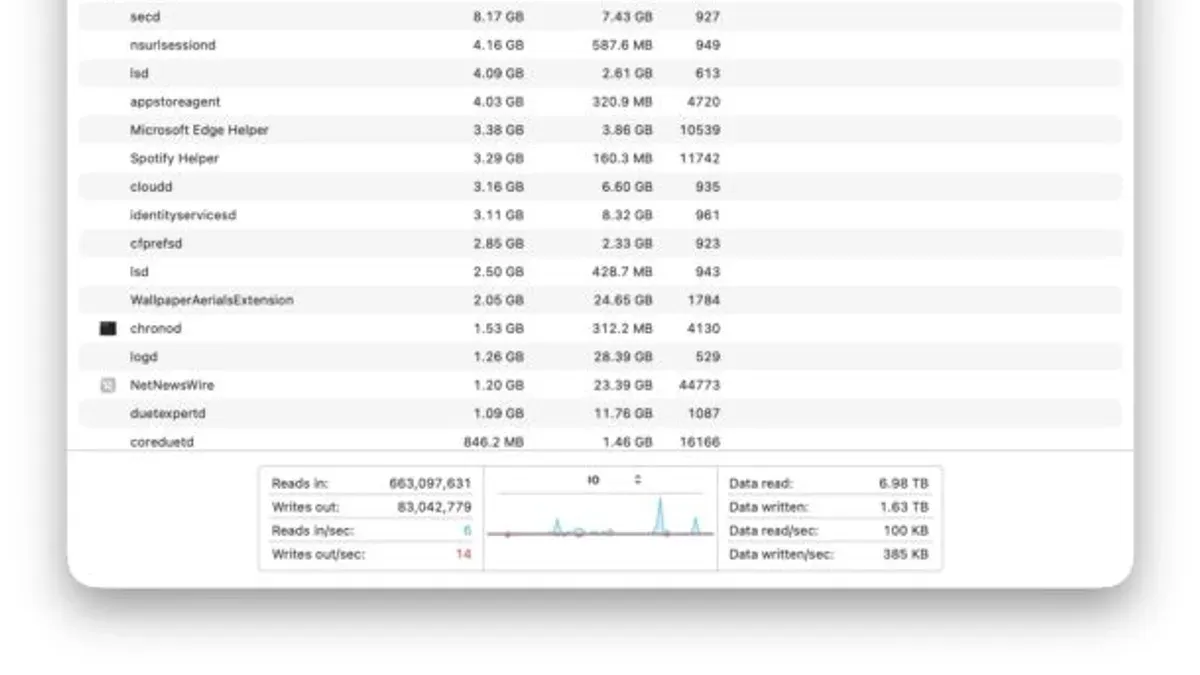
When your Mac feels sluggish or apps take longer than usual to respond, your disk’s read and write activity might be a key factor. Understanding how your system accesses data can help pinpoint whether disk usage is slowing things down. If you’ve ever wondered how to check disk read and write in Activity Monitor, this guide will walk you through the process step by step.
You’ll learn how to open Activity Monitor and find the Disk tab, interpret the numbers for each process, and use the disk graphs to get a system-wide snapshot. We’ll also cover monitoring external drives and network volumes, plus troubleshooting common issues that can affect disk performance. By the end, you’ll know exactly what the disk read and write activity means for your Mac’s speed and how to respond.
Key takeaways
- Open Activity Monitor from Applications > Utilities and select the Disk tab to view disk activity.
- Read and write columns show data each process is accessing in bytes per second.
- Disk graphs provide a real-time overview of system-wide disk usage.
- Monitoring external drives requires selecting them in Activity Monitor’s Disk tab.
- Common issues include high disk usage from background processes and slow external drives.
Before You Start: What You Need to Monitor Disk Activity
To check disk read and write activity effectively, you need a Mac running macOS with Activity Monitor installed. This utility is included by default in macOS versions starting from OS X 10.7 Lion onward, so most Macs in use support these features. Activity Monitor provides real-time disk input/output (I/O) data for both applications and system processes, helping you track how data moves to and from your storage.
Familiarize yourself with key terms such as read bytes (amount of data read from disk), write bytes (amount of data written to disk), and input/output operations per second (IOPS), which measures the number of read/write actions per second. Understanding these will help you interpret the numbers you see more meaningfully.
While Activity Monitor can show disk activity on external drives connected to your Mac, keep in mind that this monitoring can be limited by the drive type and connection speed. Some external volumes, especially network drives, may not report detailed I/O data.
- Open Finder and navigate to Applications > Utilities.
- Double-click Activity Monitor to launch it; the window should open showing several tabs.
- Confirm that the Disk tab is visible along the top; this tab displays the disk read/write statistics for all active processes.
- Connect any external drives you want to monitor and check if their activity appears under the Disk tab.
Having these basics set will prepare you to dive deeper into interpreting disk activity data confidently.
Open Activity Monitor and Locate the Disk Tab
To start monitoring disk read and write activity, you first need to open Activity Monitor. You can do this quickly using Spotlight by pressing Command + Spacebar, typing "Activity Monitor," and pressing Enter. Alternatively, open Finder, go to Applications, then Utilities, and double-click Activity Monitor.
- Launch Activity Monitor using Spotlight or from Applications > Utilities. You should see a window with several tabs at the top.
- Click the Disk tab near the top of the window. This tab displays disk activity metrics for all running processes on your Mac.
- Look at the columns labeled Bytes Read and Bytes Written. These show the total amount of data read from and written to the disk by each process since you opened Activity Monitor or the process started.
- Next, check Reads In and Writes Out. These columns indicate the number of separate read and write operations each process has performed, giving you insight into how often the disk is accessed.
- If you want to see additional disk metrics, right-click any column header and select more options such as Reads In Per Second or Writes Out Per Second to customize the view according to your needs.
When done correctly, you will see a clear table listing all processes with their respective disk read and write statistics, helping you identify which applications are using your disk the most.
Note: Screenshots or annotated images showing the Activity Monitor interface with highlighted disk columns can further help you visualize this setup.
Interpret Disk Read and Write Data for Each Process
- Look at the Bytes Read and Bytes Written columns to see the total amount of data each process has read from or written to the disk. These numbers show the volume of data transferred, which helps you understand how much disk bandwidth the app is using.
- Check the Reads in and Writes out columns to see the number of read and write operations performed. These counts indicate how frequently the app accesses the disk, which can affect system responsiveness.
- Compare typical apps: for example, a web browser usually shows moderate reads and writes, often in the range of a few megabytes per second, reflecting webpage loading and caching. In contrast, a file transfer app or backup tool might show very high bytes written or read, sometimes hundreds of megabytes, indicating intensive disk activity.
- Notice if an app has unusually high disk writes or reads without your direct interaction. This can signal background processes like syncing or malware. For instance, if a browser suddenly spikes in writes without loading new pages, it may be caching excessively or running scripts.
- Use these numbers together to identify potential issues: sustained high reads/writes by an unexpected process may slow down your Mac. If a process shows thousands of operations but low bytes transferred, it may be causing overhead by doing many small disk operations.
Use Activity Monitor’s Disk Graphs for System-Wide Overview
To get a broad perspective of your Mac's disk usage, focus on the Disk Activity graphs located at the bottom of the Activity Monitor window. These graphs provide real-time visualization of both read and write operations across the entire system, helping you spot patterns that individual process data might miss.
- Open Activity Monitor and make sure you are on the Disk tab. At the bottom of the window, locate the Disk Activity section, which displays two line graphs: one for reads and one for writes.
- Observe the graphs during normal use. You should see occasional small spikes corresponding to typical app activity. When you copy large files or run disk-intensive tasks, expect to see sustained high spikes indicating heavy disk usage.
- Compare these graphs over time to identify recurring patterns, such as regular backups or scheduled system tasks. Noticing a steady rise in disk writes at specific times can help you correlate activity with particular apps or background processes.
- Use the graph data together with the per-process disk activity above. If the system-wide graph shows heavy activity but no single process stands out, it might suggest multiple apps contributing or system-level processes at work.
For example, during a large file copy, the write graph will show a continuous high line, while in idle states, the graph remains mostly flat with minimal spikes. This visual confirmation can aid in diagnosing performance issues related to disk usage.
Monitor External Drives and Network Volumes
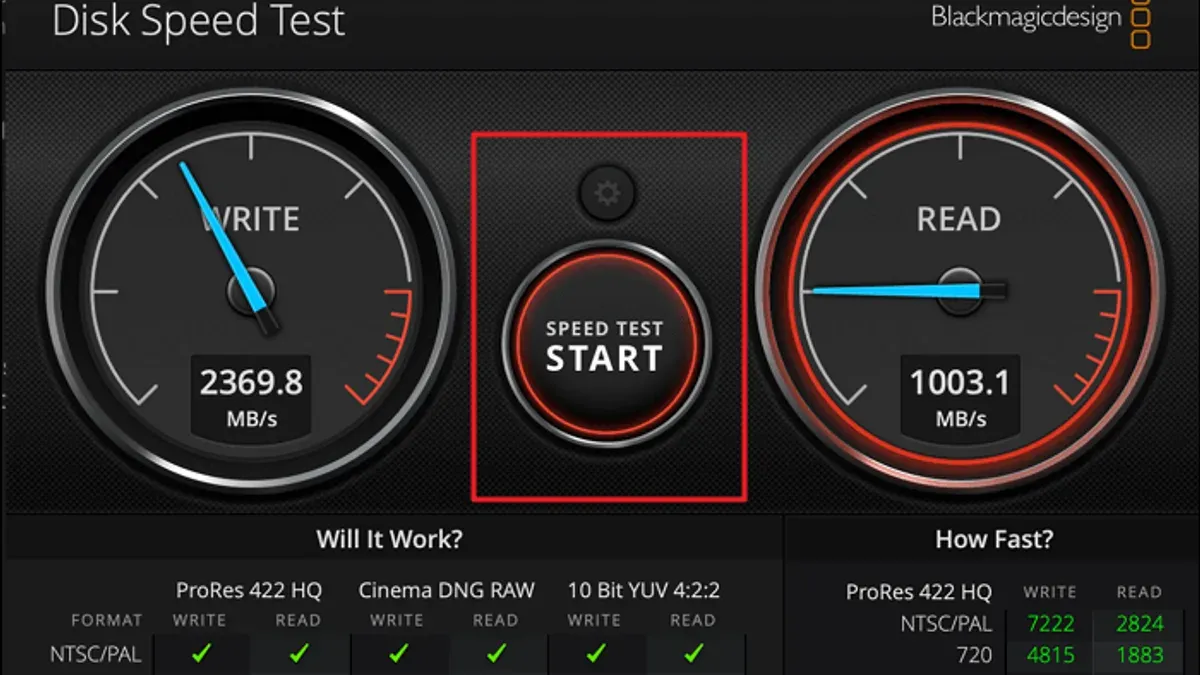
Activity Monitor displays disk read and write activity for external drives connected to your Mac, such as USB, Thunderbolt, or external SSDs. You can compare the read/write rates of these drives to your internal SSD, typically seeing lower speeds on external USB drives due to interface limitations. This helps you verify if file transfers or backups are progressing as expected.
When monitoring network volumes, such as shared drives or NAS devices, be aware that disk activity metrics may be delayed or less precise. This is due to caching and network traffic management, which can cause Activity Monitor to show slower or buffered read/write rates compared to local disks.
To ensure you see accurate data, check macOS security permissions under System Settings > Privacy & Security > Full Disk Access. Activity Monitor must have appropriate permissions to access information about external drives, or disk activity may not appear correctly.
- Connect your external drive to your Mac and open Activity Monitor.
- Go to the Disk tab and look for processes accessing the external drive; you should see read/write rates reflecting current activity.
- Start a file transfer to or from the external drive and watch the read/write columns to confirm the data flow matches expected speeds.
- If monitoring a network volume, note that activity may update with a delay; verify file operations through Finder or your network drive's interface if needed.
- Check System Settings > Privacy & Security > Full Disk Access to ensure Activity Monitor is granted permission. If not, add it and restart Activity Monitor to see external disk data.
Troubleshoot Common Issues When Checking Disk Activity
If Activity Monitor shows zero disk activity despite active system use, first confirm the process you expect to see is running. Sometimes, the display may pause or lag due to heavy system load. Try quitting and reopening Activity Monitor from the Applications > Utilities folder. When relaunched, disk activity should update in real time, reflecting current reads and writes.
If Activity Monitor itself becomes unresponsive or slow, force quit it via the Apple menu or use Command + Option + Escape, then restart. Persistent lagging may indicate system resource constraints or corrupted preferences, which can be reset by deleting Activity Monitor’s preference files located in ~/Library/Preferences/com.apple.ActivityMonitor.plist.
Disk activity units can be confusing: bytes are often shown in kilobytes (KB) or megabytes (MB). To interpret, remember 1 MB equals 1,024 KB. For example, a read rate of 500 KB/s is roughly half a megabyte per second. Keep this conversion in mind when assessing if disk usage is low or high.
If disk activity remains unexpectedly low or inconsistent, suspect hardware issues when multiple apps show minimal disk activity despite heavy use. Running Apple Diagnostics or Disk Utility’s First Aid can reveal drive errors. Software misreporting is more likely if only Activity Monitor displays anomalies; a system restart or resetting the System Management Controller (SMC) often resolves persistent display errors.
Frequently asked questions
Why does Activity Monitor show high disk writes even when I am not using the Mac?
High disk writes can occur due to background processes such as system indexing, backups, or software updates running quietly. macOS may also perform maintenance tasks like cache rebuilding or virtual memory management that generate disk activity. So, seeing disk writes during idle times is normal unless it consistently impacts performance.
Can I monitor disk activity for a specific app only?
Yes, within Activity Monitor’s Disk tab, you can focus on a specific app by locating its name in the process list. Sorting by the 'Bytes Written' or 'Bytes Read' columns helps identify the disk usage for that app. This lets you monitor how much disk activity a particular application generates in real time.
How often does Activity Monitor update disk activity data?
Activity Monitor refreshes disk activity information every few seconds, typically around once per second by default. You can adjust this update frequency by choosing View > Update Frequency in the menu bar and selecting options like 'Very Often', 'Often', 'Normal', or 'Rarely' depending on your need for detail versus system overhead.
What does 'Reads In' and 'Writes Out' mean in Activity Monitor?
In Activity Monitor, 'Reads In' refers to the amount of data your Mac reads from the disk, while 'Writes Out' shows how much data is being written to the disk. These metrics indicate the volume of disk input and output operations, helping you understand how processes interact with storage during their activities.
What This Guide Does Not Cover
Activity Monitor provides real-time disk read and write activity data but does not diagnose the underlying health of your disk or detect long-term wear and tear. If you suspect hardware issues such as failing drives, bad sectors, or persistent slowdowns related to disk integrity, you will need to use specialized diagnostic tools like Disk Utility’s First Aid or third-party applications designed for drive health monitoring. This guide focuses on understanding disk activity as it relates to system performance and app behavior rather than hardware diagnostics.
To get the most out of monitoring disk activity, the single most useful next step is to regularly check the Disk tab during periods when you notice system slowdowns or app responsiveness issues. Watching the read and write bytes per second for individual processes alongside the overall disk graph can help you identify if specific apps are heavily using your disk or if your system is generally under strain. This practice allows you to make informed decisions about closing or managing resource-intensive apps and optimizing your workflow for better performance.
See also: How to Understand Memory Pressure in Activity Monitor: A Step-by-Step Guide · How to Check CPU Temperature and Usage in Activity Monitor · How to Find Apps Using Too Much Memory in Activity Monitor · How to See Network Usage Per App in Activity Monitor: Step-by-Step Guide