How to See Network Usage Per App in Activity Monitor: Step-by-Step Guide
Track your Mac’s data usage by app with Activity Monitor to identify bandwidth-heavy applications and manage your network effectively.
Your Mac feels slower when browsing, and your monthly data cap is almost reached. You suspect some apps are using more bandwidth than they should, but you’re not sure which ones. Knowing how to see network usage per app in Activity Monitor lets you track exactly where your data is going and helps you make informed decisions about managing your bandwidth.
This guide walks you through opening Activity Monitor, navigating to the Network tab, and interpreting the data for each running app. You’ll learn how to use this information to troubleshoot connectivity issues and identify apps that consume significant network resources. By the end, you’ll feel confident monitoring your network usage with clear examples and practical tips.
Key takeaways
- Open Activity Monitor from Applications > Utilities to start monitoring network activity.
- The Network tab shows real-time data sent and received by each app.
- Look for apps with high data sent/received to identify heavy bandwidth users.
- Use this info to limit or quit data-hungry apps to manage your bandwidth.
- Activity Monitor provides live data but doesn’t log historical network usage over time.
Before You Start: What You Need to Monitor Network Usage
To successfully track network usage by app on your Mac, you need to ensure your system meets a few basic requirements. Activity Monitor’s Network tab is available on macOS versions starting from OS X Yosemite (10.10) and all later releases. Confirm your Mac is running one of these compatible versions to access detailed network statistics.
Next, you must have administrator access or sufficient permissions to view detailed process information. Without these, some app network data may be hidden or inaccessible. If you’re unsure, check your user account type in System Preferences under Users & Groups.
Understanding what network usage data represents is also crucial. Here, it refers to the amount of data each app sends and receives, measured in bytes. Activity Monitor displays this information in real time, helping you see which apps consume bandwidth.
- Check your macOS version by clicking the Apple menu and selecting “About This Mac.” You should see a version number 10.10 or higher. If not, update your macOS before proceeding.
- Verify your user account type by opening System Preferences, choosing “Users & Groups,” and confirming you have administrator or standard user privileges with process access.
- Open Activity Monitor (found in the Utilities folder within Applications). Navigate to the “Network” tab to familiarize yourself with where data on bytes sent and received per app will appear.
Open Activity Monitor and Navigate to the Network Tab
- Open Activity Monitor: Press Command + Spacebar to launch Spotlight Search, type Activity Monitor, and hit Enter. Alternatively, open Launchpad from your Dock, find the Other folder, and click on Activity Monitor. You can also open Finder, go to Applications > Utilities, and double-click Activity Monitor. Once opened, you will see a window with several tabs at the top.
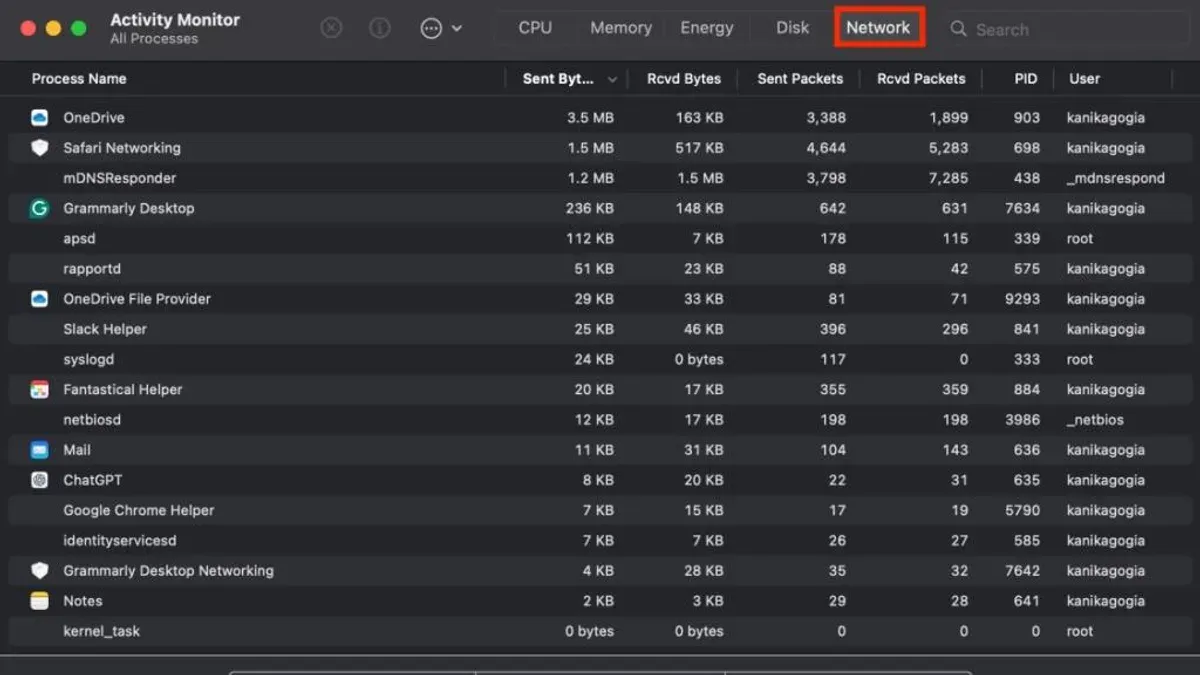
- Locate the Network tab: At the top of the Activity Monitor window, you will find tabs labeled CPU, Memory, Energy, Disk, and Network. Click on the Network tab to switch the view to network usage details. This tab displays real-time data about how your Mac's applications use network resources.
- Understand key columns: In the Network tab, focus on columns such as Process Name, which lists the running apps and processes using the network. The Sent Bytes and Received Bytes columns show the amount of data each app has sent and received, respectively, since Activity Monitor was opened. The Packets column indicates the number of data packets transmitted or received by each process. These columns help you identify which apps consume the most bandwidth.
By following these steps, you can open Activity Monitor and access detailed network usage data for individual apps, setting the stage for deeper analysis and management.
Interpreting Network Usage Data for Each App
To understand which apps are using the most data, start by sorting the processes in Activity Monitor by either Sent Bytes or Received Bytes. Click the column header for Received Bytes to see apps that are downloading the most data. For example, if you sort by received bytes and see a web browser at 120 MB and a cloud backup app at 300 MB, the backup app is your primary data consumer.
Sent Bytes shows how much data an app has uploaded, while Received Bytes indicates downloads. Spikes or sustained high numbers may reveal apps running intensive tasks, like streaming or syncing large files. If you notice a sudden jump in data usage, check which app corresponds to that time frame to identify potential causes.
Keep in mind that background processes, such as system updates or syncing services, often show network activity. These are usually labeled with system-related names. Some apps run multiple processes, so their combined data usage can appear split across several entries. To get a full picture, consider grouping related processes by app name.
- Click the Received Bytes column to sort apps by incoming data. The top entries show the highest download usage.
- Look for apps with large values, for instance, 200 MB or more, indicating heavy data use.
- Check Sent Bytes to spot apps uploading significant data, such as cloud services.
- Observe if any system or background processes appear with high usage; these may be automatic tasks.
- Note if an app has multiple processes contributing to usage; add these values mentally to assess total consumption.
Using Activity Monitor Network Data to Manage Your Bandwidth
Once you've identified which apps are using the most network data, you can make informed decisions to manage your bandwidth effectively. Start by looking for unexpected or unusually high network activity that could indicate background updates or potentially unwanted software. For example, if you notice a messaging app sending or receiving large amounts of data without your active use, it might be syncing extensive media files or running updates in the background.
Here is how you can act on this information:
- Quit or pause heavy apps: Select the app with high data usage in Activity Monitor, then click the stop button (an octagonal icon with an X) to quit it. You should see the network activity for that app drop significantly in the list, confirming it was consuming bandwidth.
- Limit app usage: For apps essential to your workflow but heavy on data, consider closing them when not needed or adjusting their settings to reduce background network activity, such as disabling auto-updates or limiting cloud sync frequency.
- Correlate with your internet plan: Compare Activity Monitor data with your internet plan limits to avoid overages. If an app frequently approaches your monthly cap, you may want to monitor it closely or restrict its network access.
- Consider dedicated network monitoring tools: Activity Monitor provides a snapshot but lacks real-time alerts or detailed history. If you need continuous tracking or notifications for spikes, explore third-party network monitoring apps designed for deeper insights.
For example, if your internet feels slow, check Activity Monitor for apps with high data send or receive rates. Quitting a heavy cloud backup app often improves speed noticeably. This hands-on approach helps you control your network environment and troubleshoot connectivity issues more efficiently.
Troubleshooting Common Issues When Viewing Network Usage
If Activity Monitor shows no network data or displays zero bytes for all apps, it often means the app or system is not currently transmitting data, or there is a temporary glitch. First, check your internet connection to ensure data is flowing. If the connection is active, try restarting Activity Monitor to refresh the data display.
- Quit Activity Monitor by selecting Activity Monitor > Quit Activity Monitor from the menu bar.
- Reopen Activity Monitor via Spotlight or Launchpad.
- Navigate back to the Network tab and observe if data now appears for apps.
If network data still seems missing or incomplete, permission settings might be restricting access. Some apps may require approved permissions in System Settings under Privacy & Security > Network to show their network activity accurately.
Keep in mind that macOS aggregates some network usage under system processes, so not all data may be attributed directly to individual apps. This is a system limitation designed to protect privacy and maintain performance.
When network information remains outdated or inaccurate, restarting your Mac can clear temporary system issues and reload network monitoring services, improving data accuracy.
Limitations of Using Activity Monitor for Network Usage Tracking
Activity Monitor offers a straightforward view of network data usage per process, but its capabilities are basic and limited. It provides real-time data on bytes sent and received by each app, yet it does not retain historical logs or detailed traffic analysis over time. If you need to review past network activity or analyze trends, Activity Monitor will not suffice.
Another significant limitation is the lack of information about where your data is going or coming from. Activity Monitor does not display the websites, IP addresses, or servers associated with the network traffic. This makes it difficult to understand the nature of the connections or detect potentially unwanted communications.
Additionally, encrypted traffic or system-level network activity may not be fully visible or accurately attributed to specific processes. This obscures some network interactions, especially those handled by the operating system or security services.
For advanced network monitoring needs, such as setting bandwidth limits, receiving alerts, or obtaining detailed traffic breakdowns by protocol or destination, specialized tools like Little Snitch, Wireshark, or TripMode are recommended. These applications provide more comprehensive data and control beyond what Activity Monitor can offer.
| Feature | Activity Monitor | Dedicated Network Tools |
|---|---|---|
| Per-process network data | Yes | Yes |
| Historical data logs | No | Yes |
| Traffic destination (websites/IPs) | No | Yes |
| Encrypted traffic analysis | Limited | Yes |
| Bandwidth caps and alerts | No | Yes |
| Detailed traffic breakdown (protocols, ports) | No | Yes |
Frequently asked questions
Can I see network usage per app over time in Activity Monitor?
No, Activity Monitor shows real-time network usage for each app but does not provide historical data or usage trends over time. To track network usage over longer periods, you would need to use third-party apps designed for monitoring bandwidth history or set up custom logging tools.
Why does Activity Monitor show zero network data for some apps?
Some apps may show zero network data because they are not currently using the network or because their traffic is very minimal and updates have not registered yet. Additionally, background processes or system-level services might not report network activity clearly in Activity Monitor.
How often does Activity Monitor update the network usage statistics?
Activity Monitor updates the network usage statistics every few seconds, typically around every 5 seconds. This refresh rate provides near real-time data but may not capture very brief spikes in network activity.
Can I export network usage data from Activity Monitor?
Activity Monitor does not have a built-in feature to export network usage data directly. However, you can manually copy the data by selecting rows and using Command+C, then pasting into a spreadsheet or text document for further analysis.
Limitations of Using Activity Monitor for Network Usage Tracking
Activity Monitor provides only real-time snapshots of your network usage and does not offer detailed historical data or analysis of traffic sources. This means you won’t be able to track network activity over extended periods or identify exactly which servers or domains your apps are communicating with. For comprehensive network monitoring, bandwidth management, or security audits, consider specialized third-party tools designed to log and analyze network traffic continuously.
If you need to monitor your network for security purposes, detect unauthorized connections, or gather long-term data usage trends, software like Little Snitch, Wireshark, or dedicated router-based monitoring solutions would be more appropriate.
To take the most practical next step, try opening Activity Monitor and observing the Network tab during your typical app usage. Pay close attention to the columns for 'Data Sent' and 'Data Received' to identify which apps consume the most bandwidth at any given moment. This hands-on approach will help you decide if you need to limit certain apps or investigate further with more advanced tools.
See also: How to Check Energy Impact of Apps in Activity Monitor: Step-by-Step Guide · How to Force Kill a Process in Activity Monitor: Step-by-Step Guide · How to Check CPU Temperature and Usage in Activity Monitor