
How to Use Data Analysis ToolPak in Excel on Mac: Step-by-Step Guide
Discover how to add, access, and use the Data Analysis ToolPak in Excel on Mac with clear instructions and tips for troubleshooting common issues.
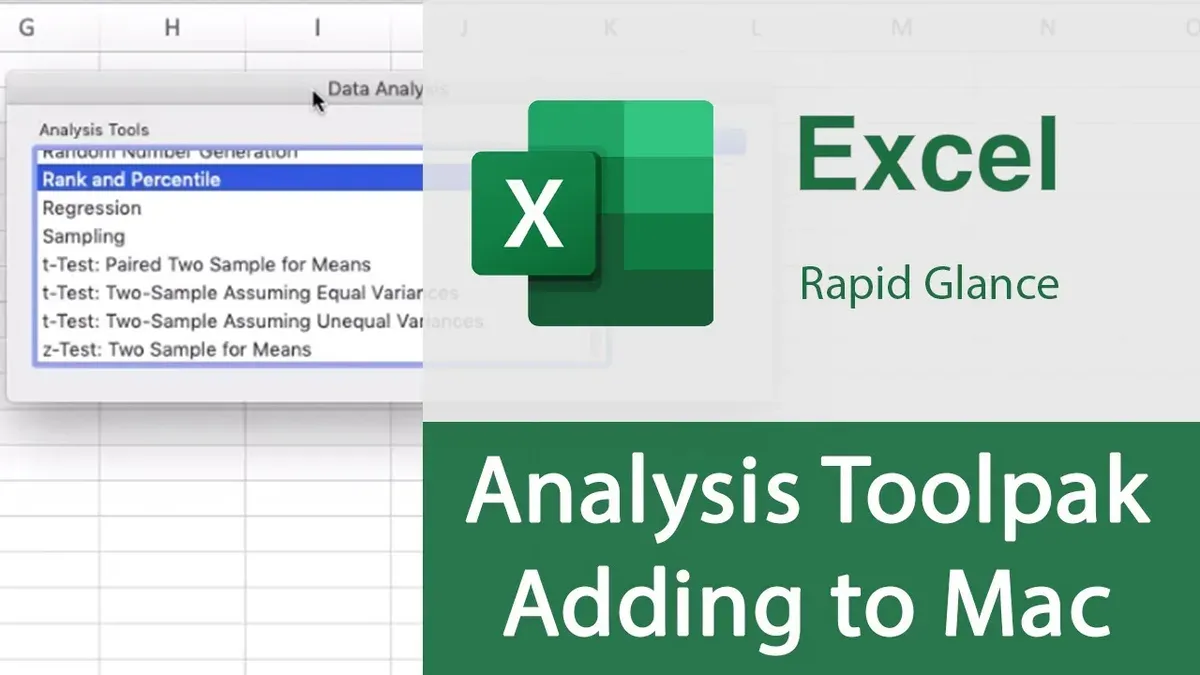
You have a dataset in Excel on your Mac and want to perform statistical analysis quickly, but you can’t find the Data Analysis ToolPak add-in. This is a common situation because the ToolPak isn’t always enabled by default on Mac versions of Excel. Knowing exactly how to use Data Analysis ToolPak in Excel on Mac will save you time and help you apply powerful statistical tools directly within your spreadsheet.
This guide walks you through each step needed to add, access, and confidently use the Data Analysis ToolPak on Mac Excel. It also covers troubleshooting common issues that Mac users face, such as compatibility and installation quirks, and explains how to update or remove the ToolPak if needed. By the end, you’ll be able to run analyses like regression, histograms, and t-tests with clear, practical instructions tailored for Mac.
Key takeaways
- The Data Analysis ToolPak must be added via Excel’s Add-Ins manager on Mac.
- Access the ToolPak through the Data tab once it’s enabled.
- Common issues include missing tools due to Excel version or permissions.
- Updating or removing the ToolPak is done through the same Add-Ins menu.
- Alternatives exist if the ToolPak doesn’t meet specific analysis needs.
Before you start: What you need to use Data Analysis ToolPak on Mac
Before installing or using the Data Analysis ToolPak in Excel on Mac, it is essential to confirm that your Excel version supports it or suitable alternatives. The built-in Analysis ToolPak is available in Microsoft Excel for Mac versions 2016 and later, but some features may be limited compared to Windows versions. For older versions or when extra functionality is required, third-party add-ins offer similar statistical tools but may need separate installation and permissions.
On Mac, Excel add-ins require specific system permissions to run correctly. You typically need to approve these in System Preferences under Security & Privacy by allowing Excel to load external add-ins. Ensuring you have these permissions prevents common issues during installation and use.
The Data Analysis ToolPak provides tools for statistical analysis such as descriptive statistics, histograms, t-tests, regression, and ANOVA. This makes it useful for summarizing data trends, hypothesis testing, and modeling within Excel without requiring external software.
Supported Excel Versions and Feature Comparison
| Excel Version for Mac | Built-In Analysis ToolPak | Third-Party Add-Ins |
|---|---|---|
| Excel 2016 and later | Available with core statistical tools | Optional for extended features |
| Excel 2011 and earlier | Not available | Required for statistical analysis |
Make sure your Excel version matches these requirements before proceeding to installation. Preparing your Mac by checking permissions and understanding the available tools will help you use the ToolPak smoothly.
How to add Data Analysis ToolPak in Excel on Mac
First, check if the Data Analysis ToolPak is already available in your Excel. To do this, open Excel and click on the Tools menu, then select Add-Ins. A dialog box will appear showing a list of available add-ins. If Analysis ToolPak or Analysis ToolPak - VBA is listed, simply check the box next to it and click OK. Once enabled, you should see the Data Analysis option under the Data tab.
If the ToolPak is not listed, it means the native add-in is not pre-installed in your version of Excel or your Mac OS. In this case, you will need to download a third-party Data Analysis add-in compatible with Mac Excel. Websites like Microsoft AppSource or trusted software providers offer these add-ins. After downloading, open the installer and follow the prompts to add the add-in to Excel.
To manage add-ins, go back to Tools > Add-Ins in Excel. Here, you can enable, disable, or remove any installed add-in. Note that in some versions of Excel for Mac, especially those updated for the latest Mac OS releases, the Add-Ins menu may appear under Excel > Preferences > Ribbon & Toolbar or Excel > Preferences > Add-Ins. This slight variation depends on the Excel and Mac OS versions you have, so look for the Add-Ins option accordingly.
After enabling or installing the ToolPak, restart Excel to ensure the add-in loads correctly. You should then find the Data Analysis command in the Data tab, ready for use.
How to access Data Analysis ToolPak in Excel on Mac
Once you have enabled the Data Analysis ToolPak in Excel on your Mac, you need to know where to find it to start your statistical analysis. The location can vary slightly depending on your Excel version, but generally, you will find the Data Analysis tools within the "Data" tab in the Ribbon.
- Open Excel and click on the Data tab in the Ribbon at the top of the window. You should see a group called Analysis on the right side of this tab.
- Look for the button labeled Data Analysis. Clicking this button opens the Data Analysis dialog box with the various statistical tools available. If you see this button, the ToolPak is properly enabled.
- If the Data Analysis button is not visible on the Ribbon, you can add it to your Quick Access Toolbar for easier access. To do this, click the downward arrow at the far right of the Quick Access Toolbar (above or below the Ribbon).
- Select More Commands... from the dropdown menu. In the Excel Options window that opens, choose All Commands from the "Choose commands from" dropdown.
- Scroll down and find Data Analysis, select it, then click Add >> to move it to the Quick Access Toolbar list. Click OK to save. Now the Data Analysis button will appear in the Quick Access Toolbar for instant use.
- Note that in some versions of Excel on Mac, the UI layout may differ slightly. For example, the Analysis group might appear under a different tab named Tools or within a dropdown menu. If you cannot find Data Analysis on the Data tab, check the Tools menu or use the Quick Access Toolbar customization described above.
- To confirm the ToolPak is enabled, the Data Analysis dialog should open without error when you click the button. If you receive a message that the ToolPak is unavailable, revisit the add-in installation steps.
Annotated screenshots of the Excel interface highlighting the Data tab, Analysis group, and Quick Access Toolbar customization are useful to visually guide you. These images typically show the Data Analysis button highlighted in the Ribbon and the steps to add it to the toolbar.
How to use Data Analysis ToolPak in Excel on Mac
Using the Data Analysis ToolPak in Excel on your Mac lets you perform statistical tasks quickly and accurately. Let's walk through a common example: calculating descriptive statistics for a data set. This will help you understand how to input data, run the analysis, and interpret the results.
- Enter your data in a single column or row without empty cells. For example, input sample sales figures in cells A1 through A10.
- Go to the Data tab on the Excel ribbon and click Data Analysis. A dialog box appears with a list of analysis tools.
- Select Descriptive Statistics and click OK. You will see a new dialog specifically for descriptive stats settings.
- In the Input Range box, enter your data range (e.g., A1:A10). Choose Grouped By Columns if your data is in a column.
- Select where to place the output: either Output Range in your worksheet or a New Worksheet Ply. Then, check the box for Summary statistics to get key metrics.
- Click OK to run the analysis. Excel will generate a table showing mean, median, mode, standard deviation, and more.
Review the output carefully. The mean provides the average value, while the standard deviation shows data spread. If your input range includes blank or text cells, the ToolPak may produce errors or omit data, so check your selection before running the tool.
Within the ToolPak dialogs, you can customize options like confidence level for mean or whether to include labels if your data has headers. Paying attention to these settings ensures your analysis matches your dataset structure.
Common errors include selecting incorrect data ranges or mixing numbers with text. Always verify your selected range reflects only numeric data without gaps. This prevents inaccurate or incomplete analysis results.
How to troubleshoot common issues with Data Analysis ToolPak on Mac
If you find the Data Analysis option missing after installation, first confirm the add-in is enabled. Go to Tools > Excel Add-ins, check the box for Analysis ToolPak, and click OK. If it still doesn’t appear under the Data tab, restart Excel and check again.
Compatibility problems often arise when using an outdated Excel version or Mac OS. Ensure your Excel and Mac OS are updated by navigating to Help > Check for Updates in Excel and System Preferences > Software Update on your Mac. Incompatible add-ins can cause crashes or freezes; if this happens, disable other add-ins one by one via Tools > Excel Add-ins to identify conflicts.
Common error messages include "Cannot run the macro because it is disabled" and "This add-in is not currently installed." For the former, enable macros under Excel > Preferences > Security & Privacy. For the latter, reinstall the add-in or choose the correct version matching your Excel and Mac OS.
Frequent freeze issues during analysis often result from large datasets or insufficient Mac memory. Try closing other applications, reducing dataset size, or splitting the analysis into smaller parts. If crashes persist, resetting Excel preferences by deleting the com.microsoft.Excel.plist file in your Library folder can resolve corrupted settings.
- Open Excel and navigate to Tools > Excel Add-ins.
- Ensure Analysis ToolPak is checked and click OK. You should see the Data Analysis option under the Data tab.
- If missing, restart Excel and check again; if still missing, update Excel and Mac OS.
- If crashes occur, disable other add-ins one at a time to find conflicts.
- For macro errors, enable macros at Excel > Preferences > Security & Privacy.
- If freezes continue, reduce dataset size or reset Excel preferences by deleting com.microsoft.Excel.plist.
How to update or remove Data Analysis ToolPak on Mac
Maintaining the Data Analysis ToolPak on your Mac ensures smooth statistical analysis without interruption. Before making any changes, back up your Excel workbooks to prevent data loss, especially those that use ToolPak features. You can save copies on your Mac or an external drive to keep your data secure.
To check for updates, first ensure your Excel application is up to date, as the ToolPak updates often come bundled with Excel updates. Go to the Excel menu, select Help, then Check for Updates. If an update is available, follow the prompts to install it. After updating Excel, verify if the ToolPak add-in has new versions or fixes by opening the Tools menu, selecting Add-Ins, and looking for update options next to the Data Analysis ToolPak entry.
- Open Excel and click the Tools menu, then choose Add-Ins. You should see a list of installed add-ins including the Data Analysis ToolPak.
- To disable the ToolPak temporarily, uncheck the box next to it and click OK. Excel will stop loading the add-in, but your existing spreadsheets remain intact.
- To remove the ToolPak completely, select it in the Add-Ins list and click the Remove button (if available). Confirm the removal when prompted. This deletes the add-in from Excel, and any spreadsheets relying on its features may lose related functionalities.
- After disablement or removal, reopen your spreadsheets to confirm they open without errors. Formulas or tools depending on the ToolPak may show errors or warnings, so review and adjust accordingly.
By following these steps, you keep your Data Analysis ToolPak updated or safely remove it without risking your core Excel data. Remember that removing the add-in affects only the add-in's availability, not your saved data, but some statistical tools in your sheets might stop working until the add-in is reinstalled.
Alternatives to Data Analysis ToolPak on Mac and when to use them
While the Data Analysis ToolPak offers a convenient way to perform many statistical analyses within Excel on Mac, it has some limitations in functionality and flexibility. You might find it useful to explore Excel’s built-in functions and formulas for certain types of analysis, such as AVERAGE, STDEV.P, CORREL, and LINEST, which allow for customized calculations without add-ins. These functions are accessible directly in Excel’s formula bar and can handle many basic to intermediate analytical needs.
For more advanced or specialized analysis, third-party add-ins like XLSTAT, Analyse-it, and Solver offer extended capabilities, including multivariate analysis, advanced regression, and optimization tools. These add-ins often provide user-friendly interfaces and detailed output reports, which can be beneficial for complex projects or professional research.
You should consider switching or supplementing the ToolPak with these alternatives when your analysis requires methods not supported by the ToolPak, when you want more graphical output options, or when you need better integration with statistical programming standards.
| Feature | Data Analysis ToolPak | Excel Built-in Functions | Third-Party Add-ins |
|---|---|---|---|
| Basic Statistics (mean, median, mode) | Yes | Yes | Yes |
| Advanced Regression Analysis | Limited | Partial (LINEST) | Comprehensive |
| Multivariate Analysis | No | No | Yes |
| Graphical Output | Basic charts | Customizable charts | Enhanced visualization tools |
| User Interface | Simple wizard | Formula-based, manual | Intuitive, guided |
| Cost | Free with Excel | Free with Excel | Usually paid |
Example scenario: If you need to perform a principal component analysis or cluster analysis, the ToolPak won’t support these directly, so using XLSTAT or Analyse-it would be more appropriate. For quick averages or correlations, Excel built-in functions might be faster and simpler.
Frequently asked questions
How to install data analysis toolpak in excel on mac?
On Mac Excel, the Data Analysis ToolPak is not installed as a separate add-in like on Windows. Instead, you enable it through the built-in Analysis ToolPak option in Excel. Go to the Tools menu, select Add-Ins, then check the box for "Analysis ToolPak" and click OK. This activates the tool and makes its functions available.
How to download data analysis toolpak in excel on mac?
You do not need to download the Data Analysis ToolPak separately for Mac Excel. It comes included with Excel but must be enabled in the Add-Ins section. If you don’t see it, ensure your Excel version supports it and is fully updated through the Microsoft AutoUpdate tool.
How to get data analysis toolpak in excel on mac?
To get the Data Analysis ToolPak in Excel on Mac, open Excel and click Tools > Add-Ins. Then, select the checkbox for "Analysis ToolPak" and press OK. Once enabled, you can find the Data Analysis tools under the Data tab in the Ribbon.
How to enable data analysis toolpak in excel on mac?
Enable the Data Analysis ToolPak by going to Tools > Add-Ins in Excel on your Mac. Check "Analysis ToolPak" and click OK. If the option is missing, confirm your Excel version supports it and update your software as needed.
How to add data analysis tool in excel on mac?
Adding the Data Analysis Tool on Mac Excel involves activating the Analysis ToolPak add-in via the Tools menu. Open Tools, select Add-Ins, then check "Analysis ToolPak" and click OK. This action adds the data analysis features to your Excel Ribbon under the Data tab.
What This Guide Does Not Cover
This guide focuses exclusively on using the Data Analysis ToolPak with Excel on Mac. It does not cover Windows versions of Excel or other spreadsheet software like Google Sheets or LibreOffice. If you are using an older Mac Excel version that lacks native support for the ToolPak, you may need to explore third-party add-ins or alternative software for data analysis. Additionally, the ToolPak offers a basic set of statistical tools, which means it may not meet the needs of users requiring advanced or specialized statistical functions commonly found in dedicated software such as R, SPSS, or SAS.
For users needing highly specialized statistical analysis or handling very large datasets, consider using professional statistical software instead of relying solely on Excel’s ToolPak.
Now that you know how to add, access, and troubleshoot the Data Analysis ToolPak on your Mac, the most useful next step is to practice running a few common analyses, such as descriptive statistics or regression, on sample data. This hands-on experience will help you become comfortable with the ToolPak’s interface and options, ensuring you can confidently apply it to your real datasets.
See also: How to Enable Power Query in Excel on Mac: A Step-by-Step Guide · How to Create a Macro in Excel on Mac: A Step-by-Step Guide · How to Use the F4 Absolute Reference Shortcut in Excel on Mac