How to Inspect Element in Safari: A Clear Guide for Mac Users
This guide shows Mac users how to inspect element in Safari using built-in tools to debug and customize webpages effectively.
Inspecting elements in Safari is essential for web designers and Mac users who want to understand or troubleshoot webpage structures. This guide explains how to use Safari’s built-in tools to inspect and modify elements, helping you debug issues, learn HTML and CSS, and customize your browsing experience effectively.
Enabling the Develop Menu in Safari
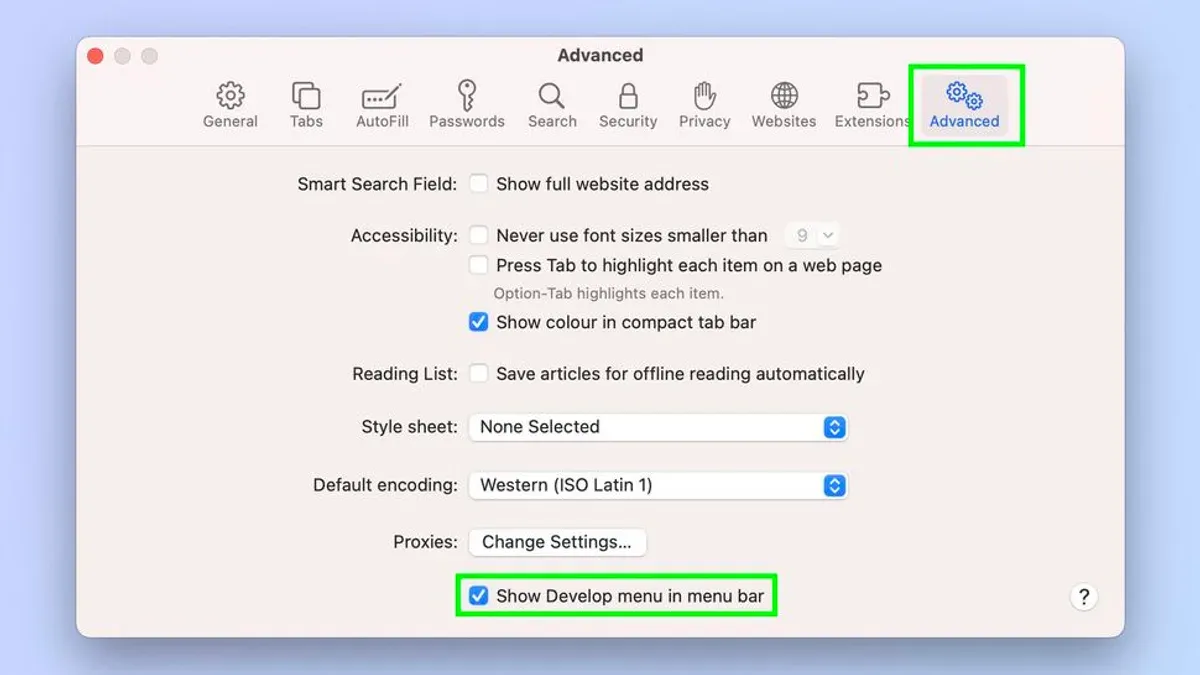
Safari’s Inspect Element feature is accessed through the Develop menu, which is disabled by default. To enable it:
- Open Safari and go to Safari > Preferences from the menu bar.
- Click the Advanced tab.
- At the bottom, check "Show Develop menu in menu bar". This step is often missed, so ensure the checkbox is selected.
On macOS Ventura and later, the steps remain the same. Note that system-wide appearance settings do not affect the activation of the Develop menu. After enabling, verify the Develop menu appears to the right of the Window menu in Safari’s menu bar.
Accessing Inspect Element: Multiple Methods Explained
There are several ways to open Inspect Element in Safari, each with different convenience levels and use cases.
| Method | How to Use | Speed | Ease of Use |
|---|---|---|---|
| Right-click Context Menu | Right-click any page element and select Inspect Element. Note that on some Mac trackpads or devices, right-click might require a two-finger tap or enabling secondary click in system preferences. | Medium | High for beginners; limited by right-click availability. |
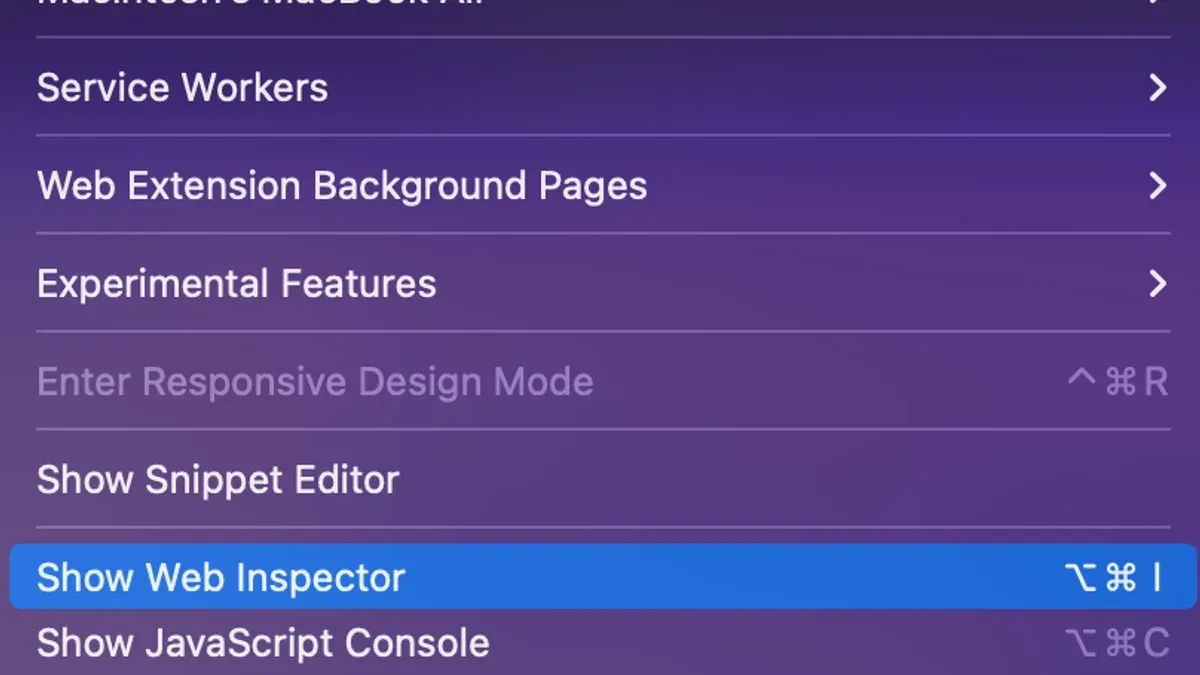
| Keyboard Shortcut | Press Option + Command + I simultaneously. This shortcut opens the Web Inspector directly. | Fast | Best for users comfortable with shortcuts. |
| Develop Menu | Use Develop > Show Web Inspector from the menu bar. This method provides full control and access to all developer tools. | Medium | Good for structured inspection and accessing advanced features. |
Understanding the Safari Web Inspector Interface
Once open, the Web Inspector presents various panels to explore and manipulate web pages.
- Elements Panel: View and live-edit HTML and CSS. Click elements to see their styles and hierarchy. A common oversight is forgetting to select the correct element in nested structures.
- Console Panel: Type and run JavaScript commands; view errors and warnings. Useful for debugging scripts.
- Network Panel: Monitor resource loading times and requests. Note that caching can affect network timings.
- Sources Panel: View page scripts and debug JavaScript with breakpoints.
- Storage Panel: Inspect cookies, local storage, and session storage. Changes here affect only your local browser session.
Editing HTML or CSS in the Elements panel changes the page instantly but only temporarily. For example, selecting a paragraph element lets you alter its text or modify its CSS color property live. Remember that these changes reset upon page reload.
Practical Examples: Inspecting and Editing Elements Step-by-Step
Here is a basic example of changing text content and CSS style on a live page.
- Right-click the text you want to change and choose Inspect Element.
- In the Elements panel, double-click the text within the <p> tag and type your new content.
- Press Enter to see the change immediately on the page.
- To change the style, in the Styles pane next to Elements, find the
colorproperty and modify its value (e.g.,color: red;). - Observe the text color change live without refreshing the page.
For debugging layout issues, inspect container elements and check CSS properties like display, margin, or padding. Adjusting these can reveal causes of broken layouts. A common pitfall is overlooking inherited styles or media queries affecting the element.
Advanced Tips: Using Inspect Element to Learn Web Design
Beyond debugging, Inspect Element is a powerful learning tool.
- Reverse-engineer layouts: Inspect complex grid or flexbox structures on popular sites to understand CSS strategies. Keep in mind that some layouts rely on JavaScript, which might not be obvious from static inspection.
- Explore styles: Examine fonts, colors, and spacing to gather inspiration. Note that computed styles may differ from declared styles due to cascading and specificity.
- Save snippets: Copy adjusted CSS rules or HTML segments into your own editor for experimentation or reuse. Remember to test changes across browsers for compatibility.
These steps help demystify how websites are built and improve your web design skills through hands-on practice.
Limitations and When to Use Other Tools
Safari’s Web Inspector is useful but has limitations compared to other browsers.
| Feature | Safari Web Inspector | Chrome DevTools / Firefox DevTools |
|---|---|---|
| Advanced Profiling | Basic CPU and memory profiling; lacks detailed timeline and flame charts. | More comprehensive with timeline and flame charts. |
| Network Emulation | Limited or no throttling options; cannot simulate different network speeds or devices. | Full network speed and device emulation available. |
| Accessibility Audits | Minimal built-in tools; requires manual testing for accessibility. | Integrated accessibility analysis and reporting tools. |
| Server-side Debugging | Not supported; requires external tools. | Requires external tools. |
If you require deep profiling, network conditions simulation, or accessibility audits, consider using Chrome or Firefox developer tools alongside Safari.
Frequently asked questions
Can I inspect elements on Safari for iPhone or iPad?
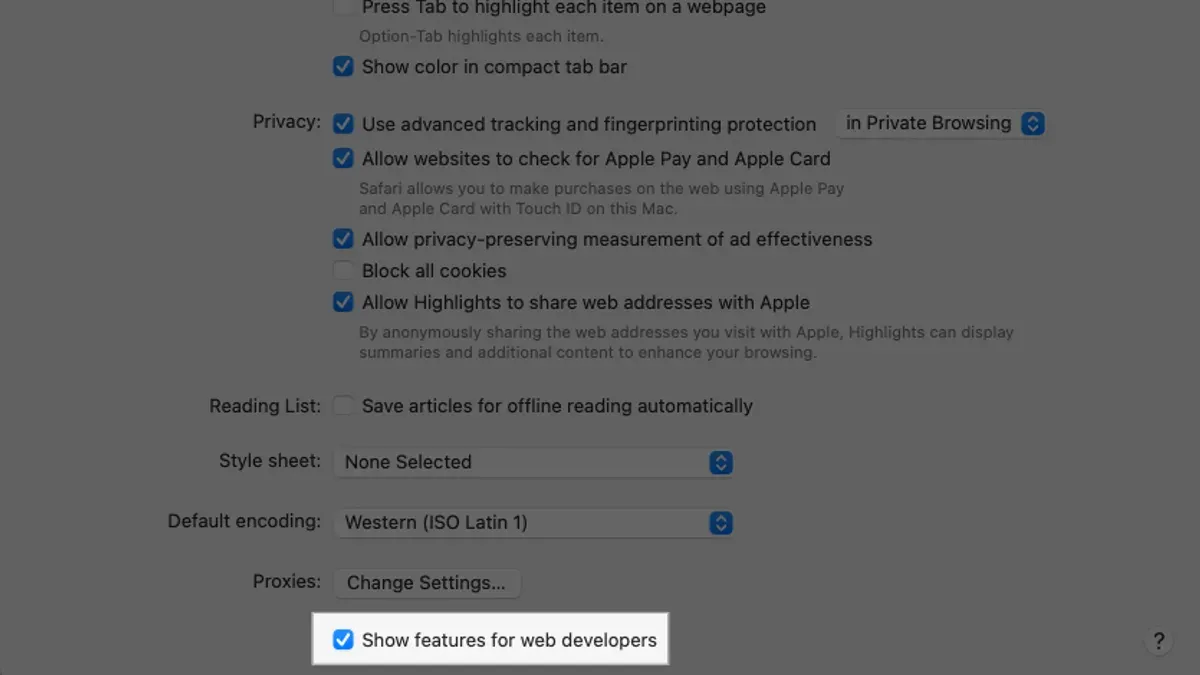
Yes. You can use Safari on macOS to remotely inspect web content on iOS devices by connecting your device via USB and enabling Web Inspector in the device’s Safari settings under Settings > Safari > Advanced. Ensure the device is trusted by your Mac.
How do I reset changes made using Inspect Element?
Reload the webpage. All modifications made via Inspect Element are temporary and revert when the page refreshes.
Is it safe to use Inspect Element on any website?
Inspecting elements is safe as it only affects your local browser view. However, do not use it to attempt unauthorized access or changes to a website’s data or backend, which is illegal and unethical.
Can I save changes made with Inspect Element permanently?
No. Changes are temporary and only visible in your current session. To make permanent changes, you need to edit the website’s source files if you have access.
Caveats
- This article covers Safari’s built-in tools and excludes third-party extensions or external developer integrations.
- Changes made via Inspect Element affect only your current browser session and do not alter the actual website for others.
- Users without basic HTML, CSS, or JavaScript knowledge may find some instructions challenging.