How to Check Mac Temperature Using Powermetrics in Terminal
Discover how to use powermetrics in Mac Terminal to check your Mac's temperature and monitor CPU heat without installing extra software.
Your Mac feels warmer than usual, and you want to know if it’s running too hot. Without installing third-party software, you can check your Mac’s internal temperature directly through the Terminal.
This article explains how to check Mac temperature with powermetrics in Mac Terminal, guiding you step-by-step. You’ll learn how to run powermetrics, interpret its temperature output accurately, and understand when this built-in tool is sufficient or when alternative monitoring options might be necessary.
Key takeaways
- Running sudo powermetrics --samplers smc in Terminal reveals your Mac’s temperature sensors.
- Look for values under the “TC0P” or “CPU die temperature” entries to assess CPU temperature.
- Continuous monitoring can be done by adding the
-iflag with a time interval. - Powermetrics requires administrator privileges and may not show all sensor data on Apple Silicon Macs.
- For detailed or user-friendly monitoring, consider third-party apps if powermetrics output is insufficient.
Before you start: requirements and permissions
To use powermetrics for monitoring your Mac’s internal temperature, your device must be compatible. This tool works on Intel-based Macs and some Apple Silicon models, but availability can vary depending on your specific hardware.
You need administrator privileges because powermetrics requires sudo to access system-level sensors. Without these permissions, the command will not return temperature data.
Ensure you are running a supported version of macOS that allows Terminal access and permissions for powermetrics. The Terminal app is found in /Applications/Utilities/. Basic familiarity with Terminal commands is necessary.
Before running powermetrics, close resource-intensive applications to reduce background noise in temperature readings. This ensures you get clearer and more reliable data about your Mac’s thermal state.
- Open Terminal from /Applications/Utilities/.
- Type
which powermetricsand press Enter. You should see the path/usr/bin/powermetricsif the tool is available. - Run
sudo powermetrics --samplers smc | grep -i "temperature"and press Enter. You will be prompted for your administrator password; enter it carefully (no characters appear as you type). - If successful, powermetrics will start displaying temperature data. Seeing this output confirms proper permissions and functionality.
How to run powermetrics to check temperature
- Open Terminal on your Mac. You can find it in Applications > Utilities or search for "Terminal" using Spotlight.
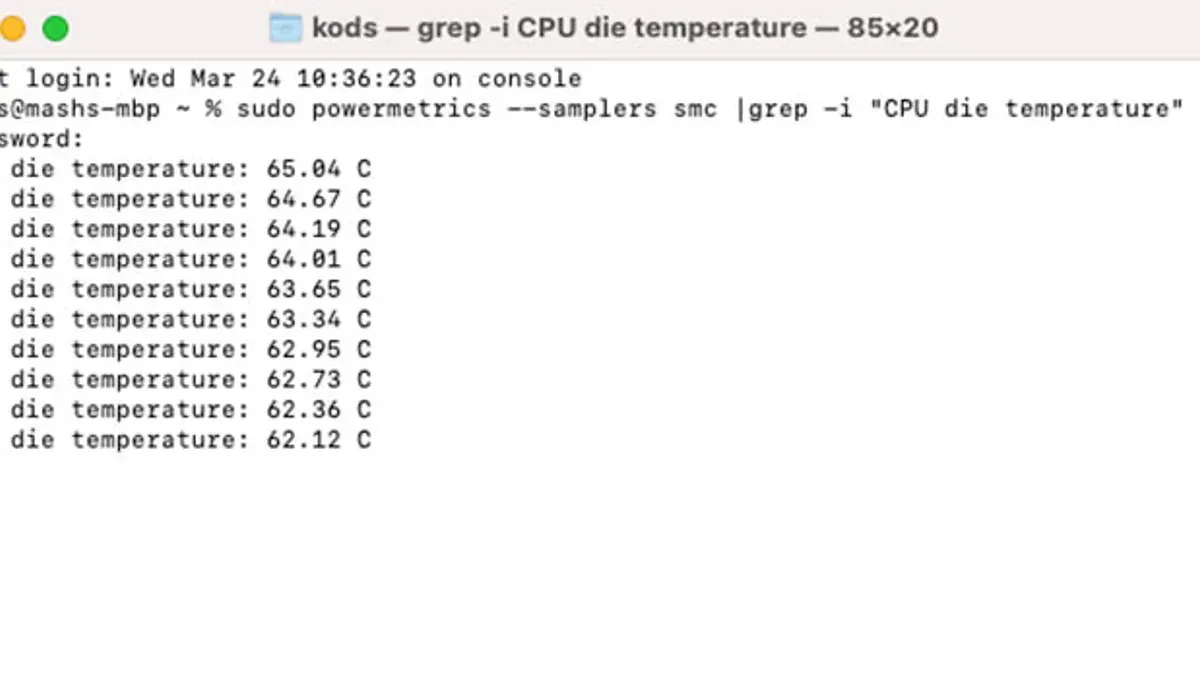
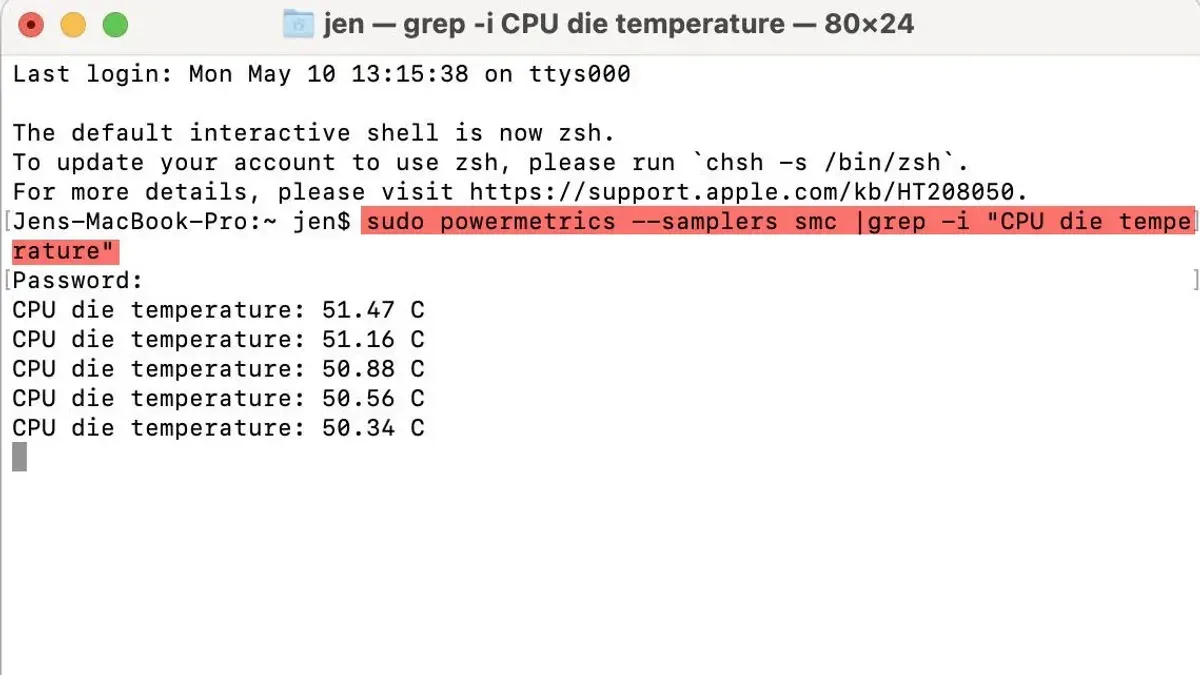
- Type the command sudo powermetrics --samplers smc and press Enter. You will be prompted to enter your administrator password; type it carefully (the input will not be visible) and press Enter.
- To stop monitoring, press Ctrl+C in the Terminal window. This will terminate the powermetrics process and return you to the command prompt.
Once running, powermetrics will display live data sampled from the System Management Controller (SMC). Look for lines under the "smc" section showing temperature readings such as CPU die temperature, along with other thermal sensor values. For example:
smc: CPU die temperature: 55.42°C
smc: GPU die temperature: 50.12°C
smc: Memory slot temperature: 48.00°C
The CPU die temperature is the main indicator of processor heat, while other readings reflect temperatures at different hardware points.
Using the --samplers smc flag ensures you receive temperature data specifically from the SMC sensors, which are responsible for thermal management. This method provides direct insight into internal temperatures without third-party tools, but the output is raw and best interpreted with an understanding of normal temperature ranges for your Mac model.
Understanding powermetrics temperature output
When you run powermetrics --samplers smc, you see temperature readings labeled by sensor type. Common sensors include CPU die (the processor core temperature), GPU die (graphics processor temperature), and battery temperature. Each sensor name corresponds to a specific hardware component's thermal status.
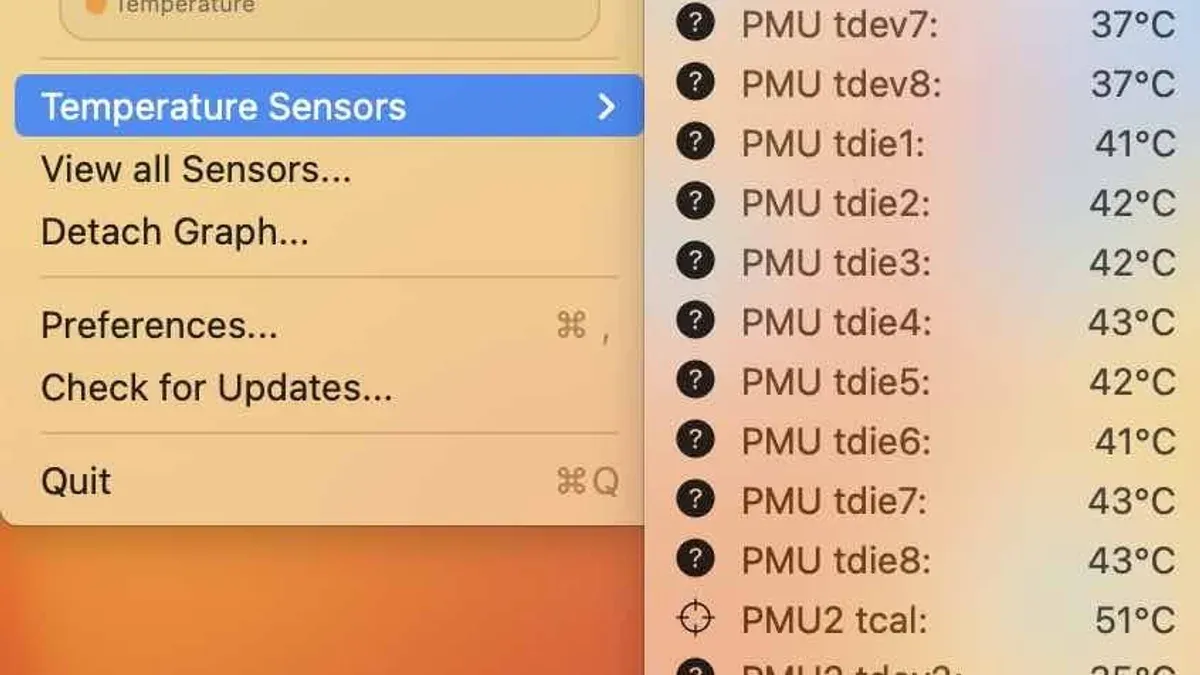
Typical safe operating temperatures for Mac CPUs and GPUs range from about 30°C to 85°C. Values consistently above 90°C indicate potential overheating, which may cause thermal throttling or hardware damage. Battery temperatures usually stay below 45°C for safety. Instantaneous readings fluctuate rapidly, so it is crucial to distinguish these from average or sustained temperatures, which better reflect system health.
To interpret the output effectively, check the temperature multiple times over a session. Small fluctuations of a few degrees are normal as workloads vary. However, frequent spikes above safe thresholds suggest cooling issues.
For example, a normal CPU die temperature might hover around 50°C at idle and rise to 75°C under load. In contrast, a high temperature reading could show values above 95°C during heavy use, signaling overheating.
| Sensor | Safe Range (°C) | Overheating Threshold (°C) |
|---|---|---|
| CPU die | 30–85 | >90 |
| GPU die | 30–85 | >90 |
| Battery | 20–45 | >50 |
- Run
sudo powermetrics --samplers smcin Terminal. You should see temperature readings labeled by sensor names appear repeatedly. - Observe the CPU die and GPU die values. Check if they remain within the safe range tabled above.
- Note whether temperatures spike suddenly or stay consistently high. Sudden spikes are normal during intensive tasks; sustained high values may indicate overheating.
- Repeat this check during idle and under load to compare normal versus high temperatures.
Using powermetrics for continuous monitoring
You can monitor your Mac's temperature over time by running powermetrics with interval flags and saving its output to a log file. This approach helps capture temperature trends rather than just single snapshots.
- Open Terminal and enter the command:
sudo powermetrics --samplers smc --interval 10 > ~/Desktop/powermetrics_log.txt
This runs powermetrics sampling every 10 seconds and redirects the output to a log file on your Desktop. You should see no immediate output, indicating logging is active. - Let the command run for as long as you want to monitor, then stop it with Ctrl+C. The log file will contain timestamped temperature readings.
- To review the log in Terminal, use commands like less ~/Desktop/powermetrics_log.txt for paged viewing or grep -i temp ~/Desktop/powermetrics_log.txt to filter temperature lines.
Continuous monitoring provides more comprehensive data, useful for diagnosing intermittent overheating. However, it uses system resources and generates large logs over time, so snapshot checks may be preferred for quick assessments.
Here is a sample excerpt from a log file showing timestamped temperature readings:
2026-10-15 14:30:10 CPU die temperature: 58.3°C
2026-10-15 14:30:20 GPU temperature: 53.1°C
2026-10-15 14:30:30 CPU die temperature: 59.0°C
Common issues and troubleshooting powermetrics
If you see command not found when running sudo powermetrics --samplers smc, it often means the Terminal path is incomplete or the command is unavailable on your macOS version. Confirm you are using a supported macOS and that you typed the command correctly.
Receiving a permission denied error usually indicates you did not use sudo. Running powermetrics requires administrator privileges, so prepend sudo to the command and enter your password when prompted.
Sometimes the temperature output is incomplete or missing certain sensor data. Powermetrics relies on hardware sensor availability, which varies by Mac model, so not all sensors are reported on every device. If data seems inconsistent, compare readings with a reliable third-party app like iStat Menus to verify accuracy.
If temperature values appear unusually low, high, or static, your system may have software or hardware issues. Check for the latest macOS updates via System Settings > General > Software Update, and consider running Apple Diagnostics to verify system integrity.
- Open Terminal and type
sudo powermetrics --samplers smc. You should see continuous temperature data; if not, proceed to the next step. - If you get command not found, verify macOS version compatibility and correct command spelling.
- If you get permission denied, ensure you used
sudoat the start. - If temperature data appears incomplete, check your Mac model’s sensor support and cross-reference with a third-party monitoring tool.
- If readings seem incorrect, update macOS and run Apple Diagnostics to identify hardware issues.
When powermetrics is not enough: alternatives for Mac temperature monitoring
Powermetrics provides detailed temperature data directly from your Mac’s sensors but has limitations. It may not cover all sensors, offers no graphical interface, and requires manual command use, which can be cumbersome for continuous or real-time monitoring.
Third-party apps like iStat Menus and Macs Fan Control offer broader sensor coverage, customizable alerts, and easy-to-read visual displays. They often update readings more frequently and provide additional system metrics, making them suitable for users wanting a comprehensive monitoring experience.
| Feature | Powermetrics | iStat Menus | Macs Fan Control |
|---|---|---|---|
| Sensor Coverage | Limited to supported SMC sensors | Extensive, includes CPU, GPU, drives, battery | CPU, GPU, fans, some battery metrics |
| Reporting Frequency | Manual intervals, terminal-based | Real-time with customizable refresh rates | Real-time with fan speed control |
| User Interface | Terminal text output only | Graphical menus and notifications | Graphical with fan control sliders |
| Additional Features | Basic temperature reporting | Network, disk, CPU usage, alerts | Fan speed customization |
Consider combining powermetrics with these tools when troubleshooting complex issues. For example, use powermetrics to verify raw sensor data, then rely on a third-party app for continuous monitoring and alerting. This approach helps ensure no overheating signs are missed, especially during intensive tasks or when diagnosing intermittent problems.
- How to Shutdown Your Mac with a Timer Using Terminal
- How to Restart Your Mac from the Command Line in Terminal
- How to Check Battery Cycle Count in Mac Terminal Easily
- How to Use sudo Safely in Mac Terminal: A Step-by-Step Guide
Frequently asked questions
Can I use powermetrics to monitor temperature on all Mac models?
Powermetrics works on most Intel-based Macs and Apple Silicon models, but the available sensor data may vary depending on the hardware. Some older Macs or specific models may not report temperature information through powermetrics, so results can differ. Always verify if your Mac model supports the temperature sensors exposed via this tool.
Is it safe to run powermetrics with sudo privileges?
Running powermetrics with sudo is generally safe because it is an Apple-provided system utility designed to access low-level hardware data. However, using sudo grants elevated permissions, so you should only run it from trusted sources and avoid modifying commands unnecessarily. This approach ensures accurate sensor readings without exposing your system to risk.
How often should I check my Mac’s temperature using powermetrics?
The frequency depends on your needs; for troubleshooting overheating, checking once during heavy use or when you notice slowdowns is sufficient. Continuous monitoring is possible but may be excessive for typical users and could impact performance slightly. Use powermetrics as needed rather than on a fixed schedule.
Why does powermetrics sometimes show different temperatures than third-party apps?
Differences arise because powermetrics reads sensor data directly from the hardware, while third-party apps often rely on system APIs or custom drivers that aggregate or interpret sensor inputs. This can lead to variations in reported temperatures, with powermetrics generally providing raw, more immediate data. Third-party tools may smooth or average readings and add user-friendly displays, but may not be as precise at the hardware level.
Powermetrics’ limitations and when to seek other tools
Powermetrics provides raw sensor data but does not offer alerts, trend tracking, or detailed diagnostics. It lacks a user-friendly interface and does not notify you of critical temperature thresholds or hardware faults. For ongoing monitoring with alerts or historical data, dedicated third-party apps are more suitable. Additionally, if you suspect hardware issues beyond temperature spikes, professional diagnostic tools or Apple Support should be consulted.
For most users comfortable with Terminal, the single most useful next step is to combine powermetrics output with Activity Monitor or sysdiagnose logs. This combined approach helps correlate temperature readings with system load and processes, enabling more informed troubleshooting of overheating or performance issues.