How to Check Uptime Using Mac Terminal: A Clear Step-by-Step Guide
Discover simple commands to check your Mac's uptime using Terminal for quick system monitoring and troubleshooting.
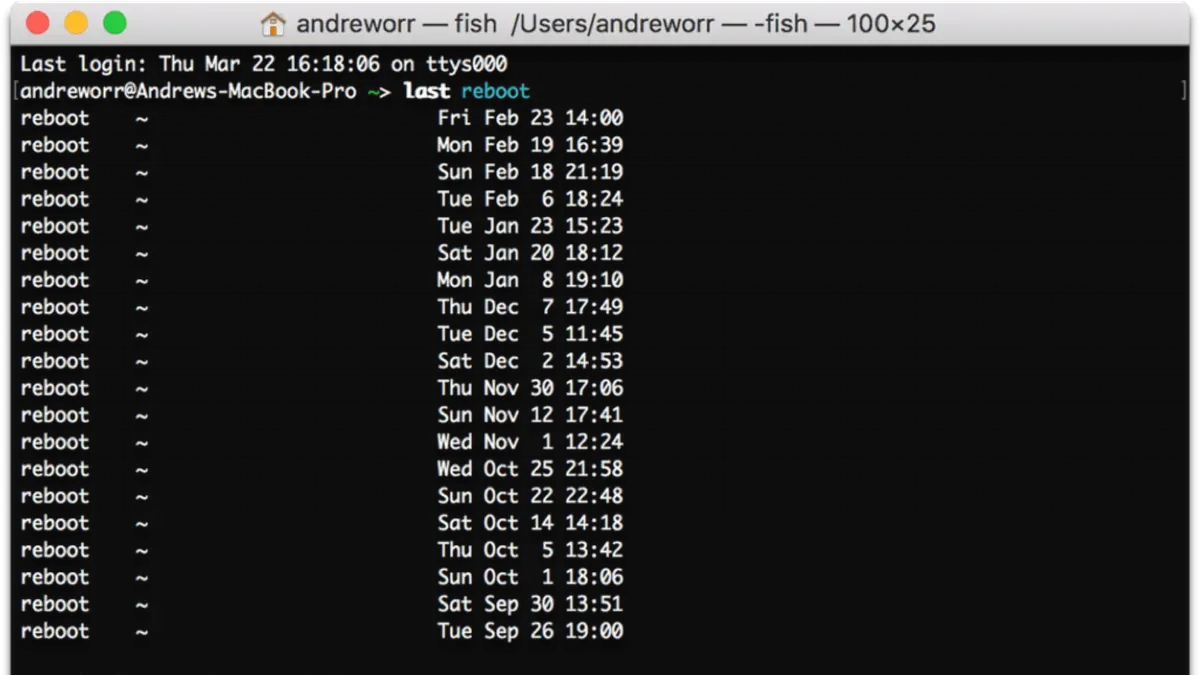
You’ve just noticed your Mac running slower than usual, or perhaps you want to confirm how long your system has been active without a restart. Knowing your Mac’s uptime can help you assess system stability, troubleshoot issues, or monitor server health effectively.
This article explains how to check uptime in Mac Terminal using multiple commands, detailing their outputs and comparing them with Linux and Unix counterparts. Whether you prefer quick summaries or detailed reports, you’ll find clear, step-by-step instructions tailored to different needs, including some tips specific to MacBook users.
Key takeaways
- Use the uptime command for a quick snapshot of your Mac’s active time.
- The sysctl command provides precise uptime in seconds, useful for scripting.
- top displays uptime alongside active processes and system load.
- Linux and Unix uptime commands share similarities but differ in output formatting.
- On MacBooks, battery and sleep states can affect uptime readings—know what to expect.
Before you start: What you need to check uptime in Mac Terminal
To check your Mac's uptime using Terminal, you need a Mac running macOS with access to the built-in Terminal app. The uptime command and related tools have been standard in macOS versions for many years, so no additional software installation is necessary.
You should be comfortable opening Terminal and typing commands. Terminal can be found in the Applications folder under Utilities, or quickly accessed via Spotlight search by typing "Terminal".
Admin or root permissions are typically not required to run uptime commands, making it straightforward for most users to perform these checks without changing system settings or permissions.
- Open Finder and navigate to Applications > Utilities > Terminal. You should see a window with a command prompt, usually showing your Mac's name and a $ symbol.
- Alternatively, press Command (⌘) + Spacebar to open Spotlight, type "Terminal," and press Enter. Terminal should launch with the command prompt ready to accept input.
Once Terminal is open, you can proceed to enter uptime commands to view your Mac’s system uptime and related information.
How to see Mac uptime with the simple uptime command
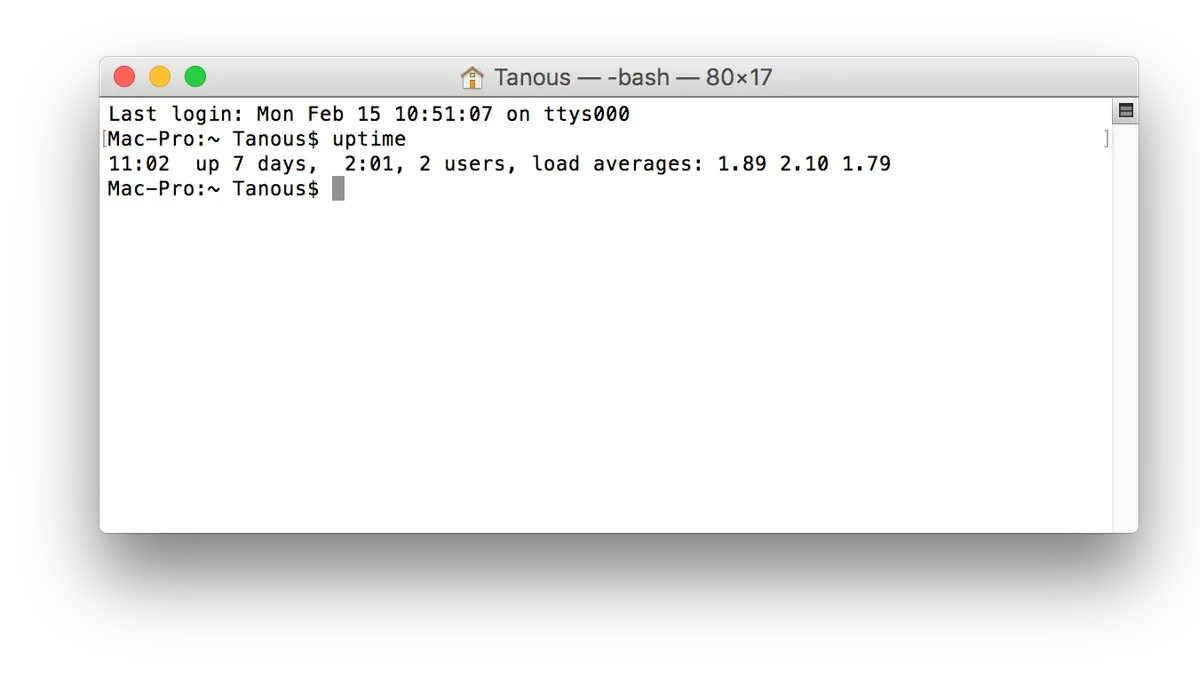
The quickest way to check your Mac’s uptime is by using the uptime command in Terminal. This command provides a concise snapshot of how long your system has been running, along with additional performance details.
- Open the Terminal app on your Mac, found in Applications > Utilities.
- Type
uptimeand press Enter. - You will see output similar to:
14:32 up 3 days, 4:15, 3 users, load averages: 1.25 0.98 0.75
This output breaks down as follows:
- 14:32 — the current system time.
- up 3 days, 4:15 — how long the Mac has been continuously running since the last reboot (3 days and 4 hours 15 minutes here).
- 3 users — the number of logged-in users at that moment.
- load averages — three numbers representing CPU load over the last 1, 5, and 15 minutes.
Load averages indicate how busy your system’s CPU is. For example, values close to or below your Mac's CPU core count suggest normal activity. Consistently high load averages may signal performance bottlenecks.
This method is fast and uses minimal resources, making it ideal for quick checks or scripting. It requires no additional options or parameters, providing a straightforward way to assess uptime alongside basic system load.
How to find uptime on Mac using the sysctl command
An alternative to the uptime command is using sysctl to get the system's boot time and calculate uptime manually. The sysctl kern.boottime command returns the exact timestamp when your Mac last booted.
- Open Terminal and enter
sysctl kern.boottime. You should see output similar tokern.boottime: { sec = 1697352000, usec = 0 } Fri Oct 15 08:00:00 2026. This shows the boot time in seconds since the Unix epoch. - To calculate uptime in seconds, subtract the boot time from the current time. You can do this with the shell snippet:
uptime_seconds=$(($(date +%s) - $(sysctl -n kern.boottime | awk '{print $4}' | sed 's/,//'))) - Convert
uptime_secondsinto a human-readable format, for example:echo "$((uptime_seconds/3600)) hours, $(( (uptime_seconds%3600)/60 )) minutes". This outputs the system uptime as hours and minutes.
This method provides a precise uptime value in seconds, unlike the uptime command which shows uptime in a more general format (days, hours, minutes) and includes load averages and user counts. It is particularly useful in scripting or when you need exact uptime metrics for monitoring or logging purposes.
How to check system uptime in Mac using the top command
The top command provides a real-time snapshot of your Mac’s system status, including uptime. To get a single snapshot, use the command top -l 1, which outputs various system statistics.
- Open Terminal on your Mac.
- Type
top -l 1and press Enter. - Look at the first few lines of the output; you will see a line beginning with Load Avg that also includes the uptime information. It typically appears as "up X days, HH:MM" indicating how long the system has been running.
For example, an uptime line might read: Load Avg: 2.34, 2.12, 1.98 up 3 days, 5:42, 4 users, load averages: 2.34 2.12 1.98. This shows the system has been up for 3 days and 5 hours 42 minutes.
Besides uptime, top displays additional data relevant to system health, such as CPU usage percentages, memory status, and the list of running processes. These details help assess overall system load and performance alongside uptime.
Compared to the uptime command, top -l 1 offers a broader context but with more verbose output. uptime is quicker and cleaner for simple uptime checks, while top is better if you want extra system metrics at the same time.
| Feature | top -l 1 | uptime |
|---|---|---|
| Uptime detail | Displays in the first few lines with load averages and user count | Shows uptime, users, and load averages in a concise line |
| Additional system info | CPU, memory, processes | None |
| Output length | Verbose | Concise |
| Use case | When detailed snapshot needed | Quick uptime check |
How to check uptime on Linux and Unix: Command line comparisons
The commands for checking uptime on Linux and Unix systems resemble those on Mac but have subtle differences in output and availability. The uptime command is common across these systems, displaying system uptime, logged-in users, and load averages. However, the exact format varies; for example, Linux uptime often presents the time since boot in a more verbose style, while Mac output includes load averages with slightly different wording.
Besides uptime, Linux and Unix users frequently use w and who commands to gather uptime-related information.
- Type
win the terminal. You should see a header line showing current time, system uptime, number of users, and load averages, followed by a list of logged-in users and their activity. - Type
who -bto display the last system boot time directly. This command works on many Linux distributions and some Unix systems but is not available on Mac.
On Mac, w is available but who -b is not supported, which can confuse users familiar with Linux. Recognizing these differences helps avoid errors when switching between operating systems or managing multiple servers.
Here is a side-by-side example of uptime output:
| Mac Terminal | Linux Terminal |
|---|---|
| 15:20 up 3 days, 4:12, 3 users, load averages: 1.46 1.39 1.20 | 15:20:15 up 3 days, 4:12, 3 users, load average: 1.46, 1.39, 1.20 |
Understanding these nuances ensures you pick the best commands for your environment and interpret their outputs correctly.
How to check uptime on MacBook specifically: Any differences or tips
Checking uptime on a MacBook uses the same Terminal commands as on other Macs, so you can rely on commands like uptime, sysctl, or top without difference. The key consideration for MacBooks is how sleep and shutdown states affect uptime reporting.
When your MacBook goes to sleep, the uptime counter continues running since the system is still technically powered on. For example, after closing and reopening the lid, running uptime might show a continuous uptime of several hours. However, if you perform a full shutdown or restart, uptime resets to zero, reflecting the fresh boot time.
Battery-related shutdowns due to power loss also reset uptime only after reboot. If the MacBook shuts down because the battery died, the next startup is a new boot, so uptime starts over. But entering sleep mode to conserve battery does not affect the uptime count.
To monitor uptime accurately on mobile Macs that enter sleep frequently:
- Open Terminal from Applications > Utilities.
- Type
uptimeand press Enter. You should see output like 14:30 up 3 days, 2:45, 2 users, load averages: 1.25 1.20 1.15, indicating continuous uptime including sleep periods. - After a shutdown or restart, run
uptimeagain. The output will reset to a much shorter time, such as 14:30 up 0:05, 1 user, load averages: 0.10 0.08 0.05, confirming the counter reset.
Understanding this behavior helps distinguish between true system uptime and periods when the MacBook was asleep but powered on, ensuring you interpret uptime data correctly.
Troubleshooting common problems when checking uptime in Terminal
If Terminal commands return errors or no output when checking uptime, start by verifying you typed the command correctly. Common error messages include command not found or permission denied. The first usually means a typo or a missing system utility, while the latter is rare for uptime commands since they require no special privileges.
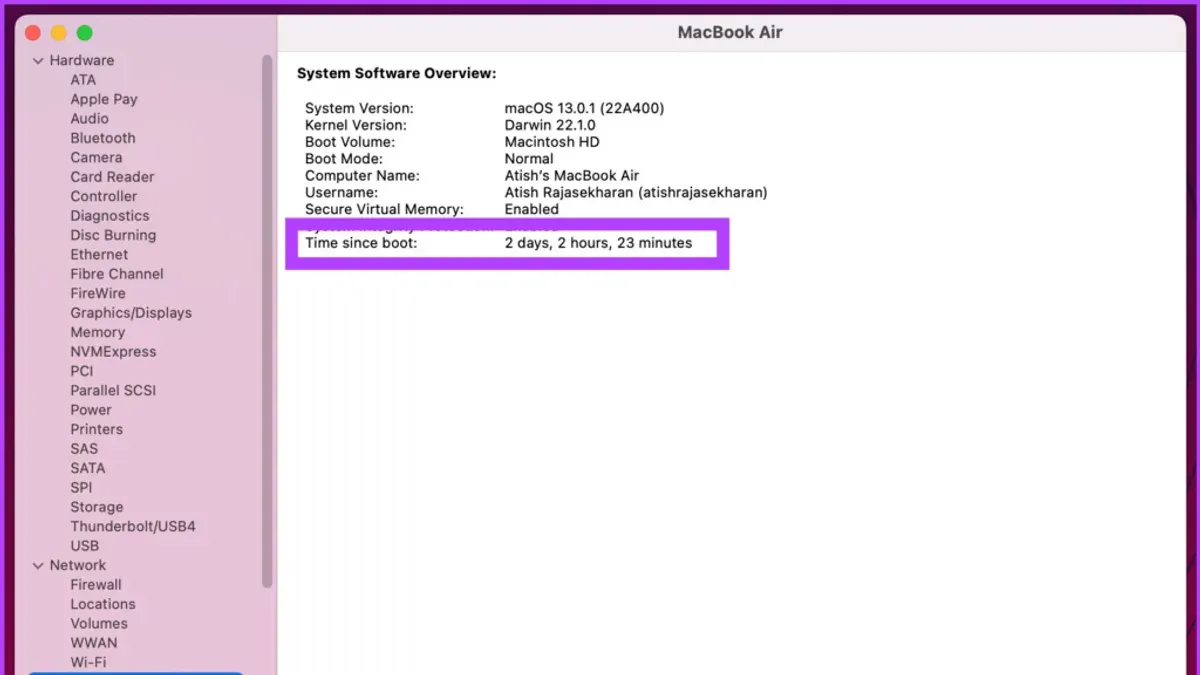
Strange or missing load averages in the output can indicate system load reporting issues or temporary glitches. If load averages show zeros or dashes, rebooting may resolve the display problem.
A short uptime value often results from a recent reboot or crash. If your system restarted unexpectedly, uptime resets to zero. Check the System Logs app or Console for crash reports if this seems unusual.
System time synchronization affects uptime accuracy. If your Mac’s clock is off, uptime calculations based on boot time can appear incorrect. Verify time settings under System Settings > General > Date & Time and ensure Set time and date automatically is enabled.
- Type uptime in Terminal and press Enter.
Expected: Output showing uptime and load averages. - If you see command not found, recheck spelling or run which uptime to confirm the command path.
Expected: Path like/usr/bin/uptime. - If load averages are missing or zero, restart your Mac and run uptime again.
Expected: Normal load average numbers appear. - If uptime shows a very short time unexpectedly, open the Console app and search for recent system crashes.
Expected: No recent crashes unless you intentionally rebooted. - Check date and time settings in System Settings to ensure automatic sync is on.
Expected: System time is correct and synchronized.
Following these steps usually resolves common issues with checking uptime on Mac Terminal.
Understanding what uptime tells you and its limitations
Uptime indicates how long your Mac has been running since the last reboot. While this measure confirms continuous operation, it does not assess system health or performance quality. For example, a Mac may show high uptime despite software glitches or hardware faults that do not trigger a reboot.
Load averages, often shown alongside uptime, provide insight into system load over one, five, and fifteen minutes. However, these numbers need context such as CPU cores and typical workload to interpret correctly. A high load average on a multi-core Mac might be normal, but the same on a single-core Mac could indicate overload.
Relying solely on uptime for monitoring critical servers is risky. Uptime cannot detect hidden failures like failing hardware components, memory errors, or software crashes that do not cause a restart. Advanced monitoring tools such as hardware diagnostics, performance profilers, and log analyzers are essential in these cases.
For instance, some servers have shown long uptimes while silently experiencing degraded disk performance or memory leaks. This demonstrates that uptime is a useful but limited snapshot of system status, best combined with comprehensive monitoring for reliable assessment.
- How to Find Large Files in Mac Terminal: Step-by-Step Guide
- How to Kill a Process by Name in Mac Terminal: Step-by-Step Guide
- How to Check Open Ports in Mac Terminal: A Step-by-Step Guide
- How to Show Hidden Files Using Mac Terminal: A Clear Step-by-Step Guide
Frequently asked questions
How to check mac uptime?
You can check Mac uptime by opening Terminal and typing the uptime command. This will display how long your Mac has been running since the last reboot, along with load averages. Alternatively, sysctl kern.boottime or top commands also provide uptime details.
How to check uptime cmd?
On Windows, check uptime by opening Command Prompt and entering systeminfo. Look for the "System Boot Time" line, which indicates when the system last started. For a quicker method, use net stats srv and find "Statistics since" for uptime information.
How to check uptime in command prompt?
In Command Prompt, type systeminfo and press Enter. Scroll to the "System Boot Time" to see when the system was last restarted. This method works on most Windows versions and provides comprehensive system details.
How to check uptime on unix?
Unix systems generally support the uptime command in the terminal, which shows system uptime and load averages. You can also check who -b to see the last boot time. These commands are standard across most Unix variants.
How to check uptime in cmd?
To check uptime in Windows CMD, run systeminfo and find the "System Boot Time" entry. Alternatively, net stats srv lists uptime since the last restart. Both commands provide reliable uptime details without extra tools.
What this advice does not cover and who should look elsewhere
This article does not cover continuous uptime monitoring tools or third-party apps for in-depth system analysis. If you require ongoing uptime tracking with alerts, detailed performance metrics, or historical logs, consider dedicated monitoring software like iStat Menus, Nagios, or commercial server monitoring solutions. Additionally, this guide focuses on Terminal commands available by default on macOS and does not address custom scripts or automation frameworks.
For the next step, try running each command covered here on your Mac Terminal to compare their output formats and information detail. This hands-on approach will help you quickly identify which method suits your needs best, whether you want a quick uptime snapshot or more granular data for troubleshooting system stability.